Observability Blogs
Latest Articles
template
category
category
observability

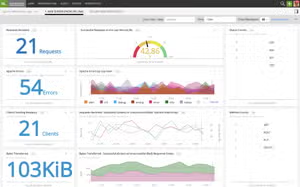
Splunk Enterprise + Visual Studio Code = Better Together
Using Visual Studio Code with Splunk Enterprise allows developers to debug user Python code, gives Splunk admins greater flexibility on editing .conf files, and brings Splunk searches and reports directly to the code editor.

Easier Multi-Dimensional Metrics in Java
Discover the two key elements to unlocking the full potential of multi-dimensional metrics in Java with Splunk Infrastructure Monitoring.

Introducing Splunk Data Links: Connect Streaming Metrics to Logs, Reduce MTTR
Data Links are now generally available in Splunk Infrastructure Monitoring, enabling DevOps teams to get to better insights and resolve issues faster by tapping into the right data from the right system at the right time.
Monitoring with Logs: Metrics from AWS FireLens, Splunk and Logstash
SignalFx is advancing its observability capabilities with the introduction of log metricization by way of an official integration with FireLens, the new log aggregation service from AWS.

An Insider’s Guide to Splunk on Containers and Kubernetes
An insider’s guide to Splunk on containers and Kubernetes. Our Splunk Enterprise and Universal Forwarder container images on DockerHub are pulled millions of times each month.

A Blueprint for Splunk ITSI Alerting - Step 1
Creating a blanket correlation rule in Splunk IT Service Intelligence to create notable events when the service health score for any service degrades

A Blueprint for Splunk ITSI Alerting - Overview
Laying out a blueprint for enterprise-wide alerting across all of your services with Splunk IT Service Intelligence (ITSI)

Top 3 Best Practices for Configuring Splunk ITSI in a Large-Scale Environment
Splunker Kan Wu shares a sample of best practices for configuring a large-scale Splunk ITSI deployment
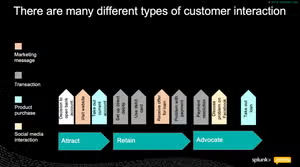
Mind The Gap! Understanding End-to-End Customer Journeys to Deliver Great Customer Experience
Bridging the gap between what companies perceive their customer journeys to be, and what actually happens.