Resolve Database Performance Issues Faster With Splunk Database Monitoring
This blog was co-authored by Akshit Grover.
Databases are the backbone of modern applications, so even a slight slowdown in database query performance can directly and severely impact the end-user experience. Most incidents require close collaboration between application and database teams to pinpoint the root cause. Yet, disjointed tooling, data silos, and a tendency to protect individual ownership often lead to delayed resolution and costly business downtime.
Today, we’re introducing Database Monitoring in Splunk Observability Cloud. Built on OpenTelemetry, Splunk Database Monitoring helps you identify and resolve slow, inefficient queries; correlate application issues to specific queries for faster root cause analysis; and accelerate fixes with AI-powered recommendations.
With this first release, we’re supporting Microsoft SQL Server and Oracle Database, with additional engines coming soon.

Troubleshoot Slow and Inefficient Database Queries
Modern enterprise environments span multiple database engines—SQL Server, Oracle, RDBMS, NoSQL, graph, and more—across hybrid and multi-cloud deployments. Each engine exposes different metrics, plan formats, and dashboards, forcing teams to context-switch between tools just to answer basic questions like “Is it the query or the server?” and “Which services are affected?” The result: slower triage, finger-pointing between teams, and rising MTTR.
Splunk Database Monitoring eliminates these silos with a unified view across all database engines and environments. You can quickly compare instances, spot hotspots, prioritize fixes, and take action at scale. For any database instance, view all queries along with rich metrics such as wait states, wait time, duration, executions, and CPU time. Detailed execution plans reveal how the database engine executes each query, helping you pinpoint performance bottlenecks and inefficiencies.
Example:
Imagine you’re an SRE for a business-critical application and receive a high CPU utilization alert for a database instance. In the query list view, you can sort queries by CPU time to isolate the culprit. Clicking into the query details, you discover from the execution plan that the highest cost comes from an Index Scan operator. The query is using the index, but instead of a seek, it’s scanning the entire index, indicating either a large result set or a poorly written predicate. With these insights, you can review and optimize the query for faster performance.

Database Monitoring helps you understand query performance and efficiency for any database instance.
Resolve Incidents Faster by Correlating Application and Database Performance
When application incidents involve the database, silos between SRE, application, and DBA teams slow everything down. APM may surface slow endpoints and database spans, but without true query-level visibility, the database often remains a black box. Database teams see hot queries and resource spikes yet can’t tell which applications or business workflows are driving them. The result: hand-offs, delays, and repeated alerts.
Splunk Database Monitoring bridges that gap. It lets you correlate deep query analytics with APM data to understand exactly how database behavior impacts services and business workflows. SRE and app teams can jump from a slow APM trace to the exact problematic query. Database teams can start from a resource-intensive query and pivot to relevant APM traces to identify which applications and services are generating the load.
Example:
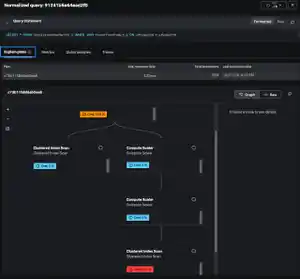
Say your application suddenly slows down. Using Splunk APM, you identify a slow database span as the cause. Instead of switching tools, you can now click directly into query details right within the APM page. The metrics reveal significant PAGELATCH_* waits, meaning the query spends excessive time pulling data from disk. Drilling into the latest execution plan, you find a full table scan causing high I/O pressure. With that insight, you add an index, improve performance, and close the incident all within Splunk Observability Cloud.

Database Monitoring surfaces detailed execution plans to help you pinpoint performance bottlenecks.
Save Developer Time With AI-Powered Recommendations
Once you’ve identified slow or inefficient queries, fixing them can be tedious and risky. Developers spend hours deciphering legacy or ORM-generated SQL, jumping between tools to understand query intent, parameters, and plan details. Under incident pressure, crafting clean, optimized rewrites is time-consuming, and issues often resurface later.
Splunk Database Monitoring accelerates this process with AI-powered summarization and recommendations. AI summarization explains long, complex queries in plain language, highlighting key inputs and potential inefficiencies. AI-powered recommendations suggest targeted optimizations such as index changes, query rewrites, or SQL hints, and even provide ready-to-run code to speed remediation.
Example:
You find that query slowness is caused by a non-SARGable predicate—specifically, a function applied in the WHERE clause:
WHERE SUBSTRING(name, 1, 2) = 'HA'
Because the function prevents index usage, the engine must fetch all rows, apply the function, and then filter results, driving up response time. Using Splunk’s AI capability, you can automatically rewrite the query into a SARGable form:
WHERE name LIKE 'HA%'
The optimized version now uses the index efficiently, improving performance with minimal manual effort.

Database Monitoring saves developer time with AI-powered recommendations
Start Monitoring Your Databases Today
Splunk Database Monitoring brings unified visibility, faster root-cause analysis, and AI-assisted optimization to your entire database environment. It helps SRE, application and database teams work together seamlessly to resolve performance issues and reduce MTTR.
Learn more in our documentation or schedule a demo today.
Related Articles

What the North Pole Can Teach Us About Digital Resilience

The Next Step in your Metric Data Optimization Starts Now

How to Manage Planned Downtime the Right Way, with Synthetics

Smart Alerting for Reliable Synthetics: Tune for Signal, Not Noise

How To Choose the Best Synthetic Test Locations

Advanced Network Traffic Analysis with Splunk and Isovalent

Conquer Complexity, Accelerate Resolution with the AI Troubleshooting Agent in Splunk Observability Cloud

Instrument OpenTelemetry for Non-Kubernetes Environments in One Simple Step
