
The State of Observability
Download our latest State of Observability survey report.

There are many different classes of web performance tools, from synthetic monitoring to application performance monitoring (APM), to real user monitoring (RUM), and more. These different classes exist because each has its own strengths and weaknesses.
When evaluating open-source or enterprise-grade synthetic monitoring tools, you want to look for capabilities that maximize its strengths. When evaluating solutions, though, it can be tough to distinguish between the nice-to-haves and the must-have features that will enable you to gain the most value out of your synthetic monitoring solution.
So, we’ve put together the lists of features any strong, enterprise-grade synthetic monitoring tool should have. Let’s take a look.
Synthetic monitoring vendors provide a remote, often global, infrastructure that visits a website periodically and records the performance data for each run. The measured traffic is not of your actual users; it is synthetically generated to collect data on page performance.
The best synthetic monitoring tools enable you to:
(Compare synthetic monitoring to RUM, or real user monitoring.)
So, which synthetic monitoring tool is the best for your environment? Here is a checklist of must-have features to help you get started:
Deciding on synthetic monitoring tools? This checklist of must-have features will help you select the best synthetic monitoring tool for your environment.
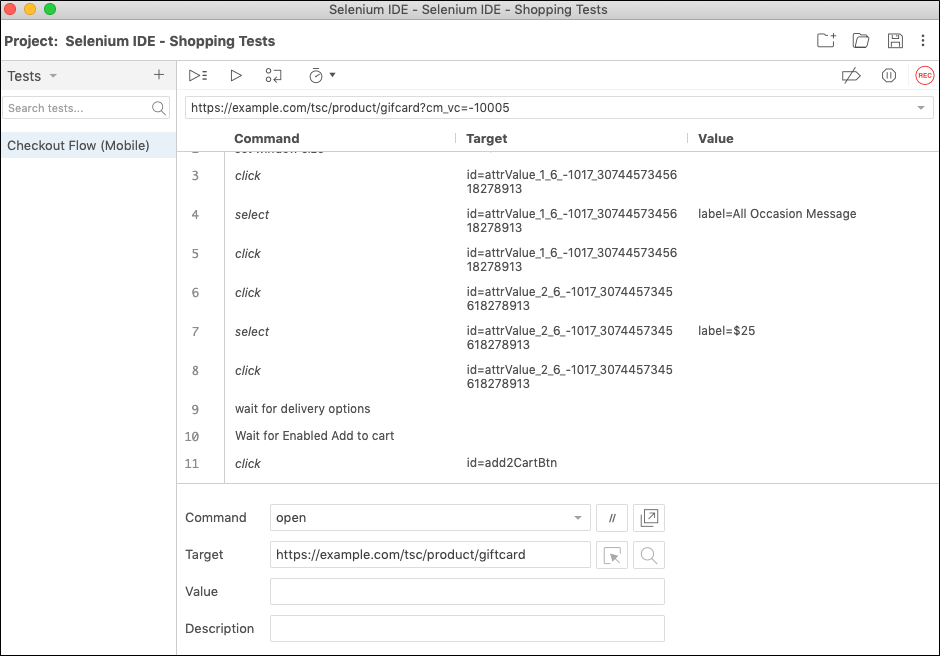
A key benefit of synthetic monitoring is that you can define the specific actions of a test, allowing you to walk through key flows of your application—a checkout flow or a sign-up flow—to verify its functionality and performance. This is called scripting, and a tool’s scripting capabilities directly determine how valuable it can be.
Here are some of the scripting capabilities that are essential to look for:
Of course, since enterprise websites change daily, and scripts can stop working, it is also important to evaluate a tool based on its troubleshooting capabilities, such as:
As an example, here is what the industry-standard Selenium IDE recorder looks like when testing a mission-critical “checkout user flow”.
A big advantage of synthetic tools is they allow you to experiment with what-if scenarios and see the impact on performance. It is essential to ensure you have flexibility and options that make it easy to get a clear line of sight of the impact of your performance initiatives. Some common examples include:
How completely a specific synthetic tool can do these things depends on how much you can control about a test. Here are some of the configuration options to look for to be able to assess the results of common web performance experiments:
Of course, configuring a test with different options is only half the battle. In all these scenarios, you will collect performance data about your sites and applications under different conditions, and then you will need to compare them.
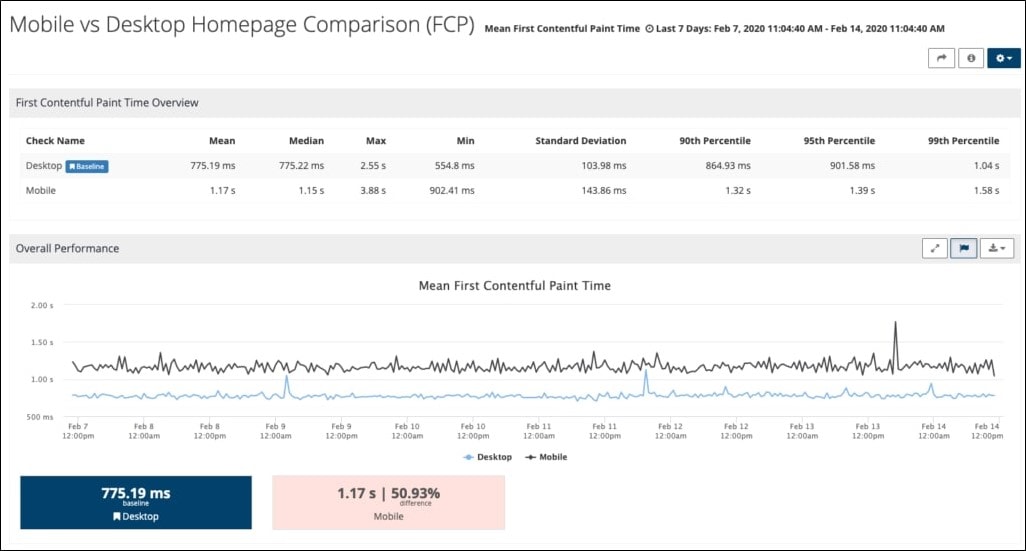
How your synthetic solution allows you to compare data and visualize differences is critical—that determines how easily and quickly you get results. Here are a few ‘must-haves’ to look for:
For example, here is what a comparison report looks like in Splunk Synthetic Monitoring:
Synthetic monitoring is one of the best ways to detect outages or availability issues since it actively tests your site from the outside. Critical to this is what capabilities does the tool have to define an outage and send the notification.
Here are a few things to look for:
Just because you had trouble accessing the site once, doesn’t necessarily mean there is an outage, or tell you if that outage is regional or global in scope. False positives can lead to alert fatigue so here are some of the more advanced capabilities to look for as well:
For example, here is a real screenshot (displayed within Splunk Synthetic Monitoring) showing off a page which returned an error:

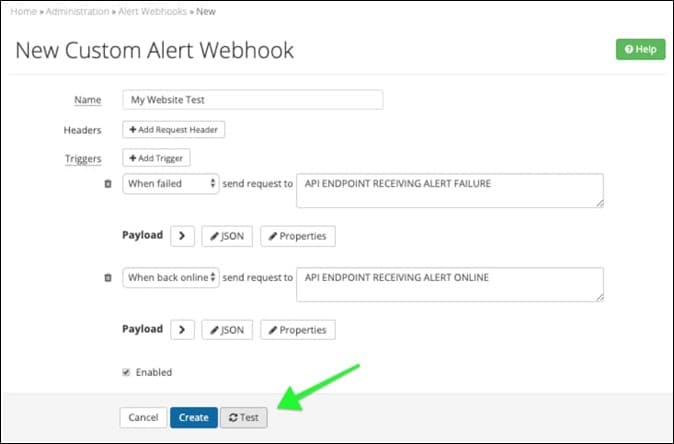
Once your synthetic monitoring solution has detected an outage, it is critical that it notifies you and your team. How you want a tool to notify you depends on the workflow of your team—email and SMS are minimums. Beyond that, you should focus on notification options that can easily integrate as tightly as possible into your team’s workflow and style. This will optimize how quickly your team can see and react to an outage.
Here are a few options to look for:
Here is what a typical custom webhook looks like. Make sure the synthetic tool you choose has similar functionality:
One of the key strengths of synthetic monitoring solutions is that they can help you assess the performance and user experience (UX) of a site without requiring large volumes of real users driving traffic. This means synthetic monitoring tools can be used in pre-production and lower environments (staging, UAT, QA, etc.) allowing you to understand the performance of your site while it’s still in development.
This is tremendously powerful—it allows you to use performance as a gate and stops performance regressions over time.
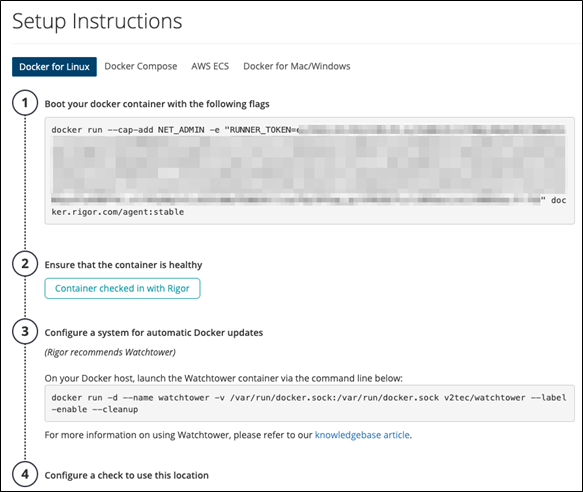
To do this, your solution must be able to reach your lower environments and gather performance data. It also must deal with some configuration nuances that are unique to testing environments. Capabilities for accessing pre-production that you should look for:
As an example, Splunk Synthetic Monitoring provides copy and paste instructions to launch a Docker instance to test pre-production sites:
A major use case of synthetic tools is to measure the performance of an industry to gain clear visibility into how your performance stacks up against others. This application is unique to synthetic monitoring because other tools, like RUM or APM, will require you to place a JavaScript tag on the site or a software agent on the backend infrastructure, something that you obviously cannot do to the websites of other companies.
With a synthetic product, benchmarking a competitor’s site is as easy as testing your own site…you simply provide a URL—and you’re done!
However, there are various web security products that sit in front of websites and can block traffic from synthetic testing tools as a byproduct of trying to block attackers, bots, and other things that can cause fraud. You may often find that the IP addresses of the cloud providers and data centers used by synthetic providers are blocked. So, one thing to consider in your synthetic monitoring solution is:
Can you run tests from locations that your competitors are not blocking?
Another reason security products used by your competitors can block synthetic tests are because of the User Agent. If the User Agent is different than what an actual browser uses, that can cause you to be blocked. Another capability to check for is:
Can you customize the User Agent to remove anything that identifies it as a synthetic testing tool?
Once you can collect performance and user experience data from a competitor, you have everything you need to compare those results to your own site, so it is important to further understand:
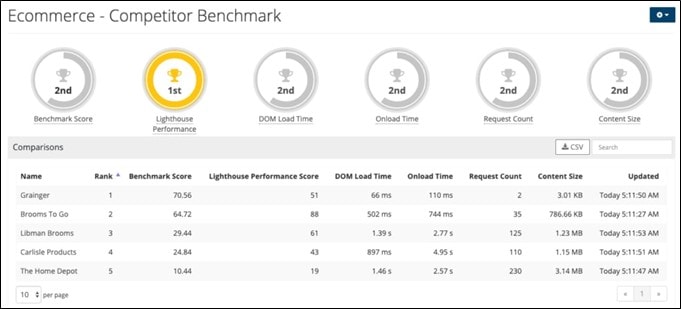
Here, Splunk Synthetic Monitoring illustrates a Competitor Benchmark dashboard:
When evaluating a synthetic web performance product, there are ‘nice-to-have’ and ‘must-have’ capabilities that will allow you to extract the most value out of your solution. As you evaluate tools, remember the use cases where synthetic testing excels:
In order to extract the most value of your synthetic solution, keep these questions in mind:
Splunk Synthetic Monitoring monitors performance/UX on the client-side and tells you how to improve and make optimizations. You can even integrate this practice into your CI/CD workflows—automate manual performance tasks and operationalize performance across the business.
This posting does not necessarily represent Splunk's position, strategies or opinion.

The Splunk platform removes the barriers between data and action, empowering observability, IT and security teams to ensure their organizations are secure, resilient and innovative.
Founded in 2003, Splunk is a global company — with over 7,500 employees, Splunkers have received over 1,020 patents to date and availability in 21 regions around the world — and offers an open, extensible data platform that supports shared data across any environment so that all teams in an organization can get end-to-end visibility, with context, for every interaction and business process. Build a strong data foundation with Splunk.

Get the latest articles from Splunk straight to your inbox.
© 2005 - 2024 Splunk Inc. All rights reserved.
