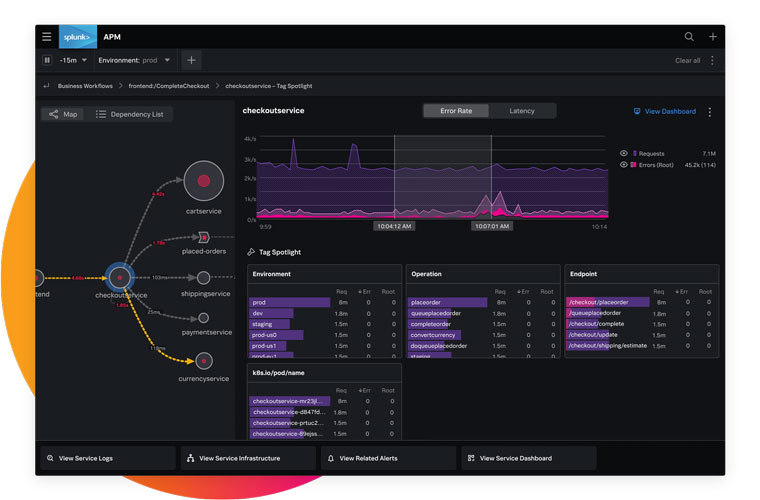
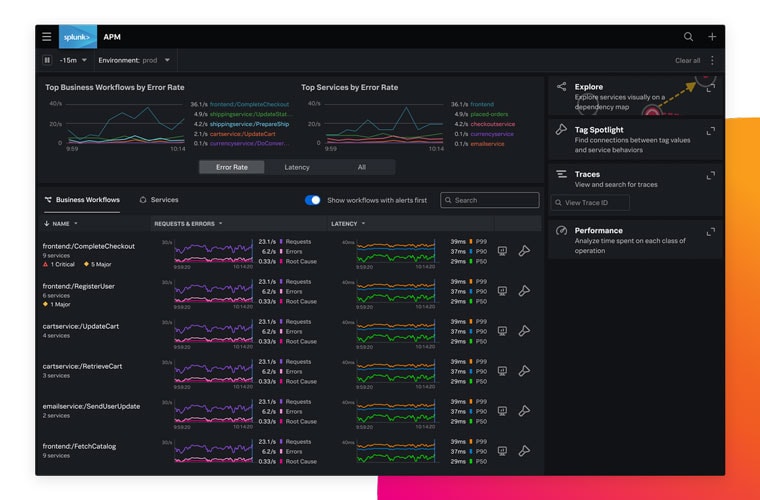
false

APPLICATION PERFORMANCE MONITORING

AI-driven APM for modern environments

Faster and simpler troubleshooting of any issue with your applications

the essential guide to modern apm

The Guide to Modern APM

Deliver exceptional app performance with Splunk

improve user experience

Improve user experience

Ensure that all issues are detected and addressed before they affect customers.

Simpler and faster troubleshooting Simpler and faster troubleshooting

Simpler and faster troubleshooting

Combine all trace data, powerful analytics, and seamless correlation with metrics and logs to reduce the load on your teams

future proof applications

OpenTelemetry instrumentation

Break free of vendor lock-in and build on the standard for distributed tracing.

CAPABILITIES

Easily resolve any anomaly at any scale

no trace left behind

NoSample™ Full-Fidelity tracing and Infinite Cardinality

Splunk APM is unique in analyzing, ingesting and storing for later use all traces with no sampling. Detect issues that are impacting the long tail of customers, and go back, investigate and get exemplars of previously unknown issues.

Combined with Infinite Cardinality, this powerful capability provides DevOps teams with a one-stop shop to see errors and latency across all the tags of any given service.

AI-Driven Analytics

Splunk APM’s built-in analytics automates the correlation between application performance, critical business KPIs, infrastructure and end-user experience. It provides meaningful alerts while eliminating alert storms and surfaces root-causes at a glance to minimize war-rooms.

troubleshoot issues in seconds
free your code

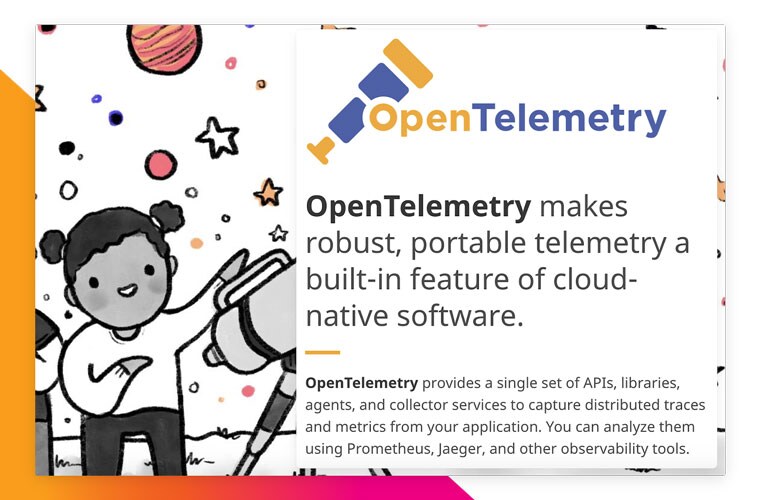
OpenTelemetry Instrumentation

OpenTelemetry has wide industry support, including all the major cloud providers, and is the second most active CNCF project after Kubernetes. Many popular OSS products already emit metrics that comply with the OpenTelemetry standard so can be instrumented with minimal developer effort.

namely namely

CUSTOMER STORY

Accelerates product development and deliver first class customer solutions

USE CASES

A comprehensive solution built for:

microservices monitoring microservices monitoring
Application Monitoring and Troubleshooting

Purpose-built for microservices

Learn More
SLO/ SLI Monitoring SLO/ SLI Monitoring
SLO/ SLI Monitoring

Improve key business metrics

Learn More
CI/CD Pipeline Monitoring CI/CD Pipeline Monitoring
CI/CD Pipeline Monitoring

Measure transformation success

Learn More

Explore more features

Powerful end-to-end full-fidelity tracing, backend to frontend.

INTEGRATIONS

Any stack, any Scale

Deploy APM effortlessly at any scale on your entire stack, for on-premises and cloud-native applications.

MORE FROM SPLUNK
Resources

The 5 Considerations When Choosing an APM Tool

What are the APM essentials for your cloud-native journey?

Read the E-Book
RELATED PRODUCTS

Deliver the best possible user experience with Splunk Observability

Troubleshoot, debug and optimize performance across your entire stack with a seamless workflow.

Explore Observability
improve front-end performance improve front-end performance

Improve Front-End Performance

Extend full-fidelity visibility into end user experiences.

Learn More
Full-Stack Observability Full-Stack Observability

Full-Stack Observability

Conquer the complexity of modern apps and infrastructure at any scale.

Learn More

Get Started

Find out how you can improve application performance with full-fidelity tracing at scale.