
Digital Resilience Pays Off
Download this e-book to learn about the role of Digital Resilience across enterprises.
TLDR = Splunked some sensor data from a Thingsee data logger while skiing and sparked questions about avalanche safety. Dashboards of skiing data below if you don’t feel like reading.
 We’ve heard it over and over again: the amount of data generated is growing exponentially. With the emergence of the Internet of Things (IoT), there is no doubt an avalanche of data (see what I did there?) coming. In fact, some say NOAA could be collecting as much as 800 terabytes of data a day, and storing over 100 exabytes by 2020. And that’s just one organization. The question we all have is how do we handle this data, no matter the structure, format, size, speed, schema, way it’s collected, and so on? Enter Splunk. I’ve had a blast, Splunking everything from servers and firewalls in 100+ terabyte/day data centers to automobiles, barbecue grills, circuit breakers, fitbits and more. The theme is always the same – my curiosity is aroused by a platform that collects and indexes machine data from just about any source — then allows me to easily search it, analyze it and visualize it without boundaries. I can make hypotheses, test them, and make conclusions with my data. I can also question everything and dream about how to use data to impact lives – like evading death from avalanches.
A few weekends ago, I took an avalanche training class (AIARE Level 1) in hopes of making smarter decisions and being more prepared for excursions in Colorado’s backcountry, where the avalanche danger and fatality rate is the highest in the country. For me, the taste for backcountry skiing is insatiable — escaping lift lines, experiencing the freshest of powder (some call it ‘mad-pow disease’!), and testing your skill and wit on the open mountain. With new technology and many new data sources today it made me wonder if it would be possible to decrease the number of fatalities due to avalanches. Seeing recent headlines like these remind me of the constant danger. While I didn’t actually have avalanche sensor data to Splunk (yet), it did spark some thinking about the future of avalanche safety and how Splunk could be used to ingest, correlate and predict data. A few places are installing sensors in avalanche prone areas to help identify and predict avalanche conditions. But this is just the start. Access to weather data and the increased prevalence of sensor collection devices like Thingsee will allow us to make better, real-time correlations and therefore make predictive models stronger.
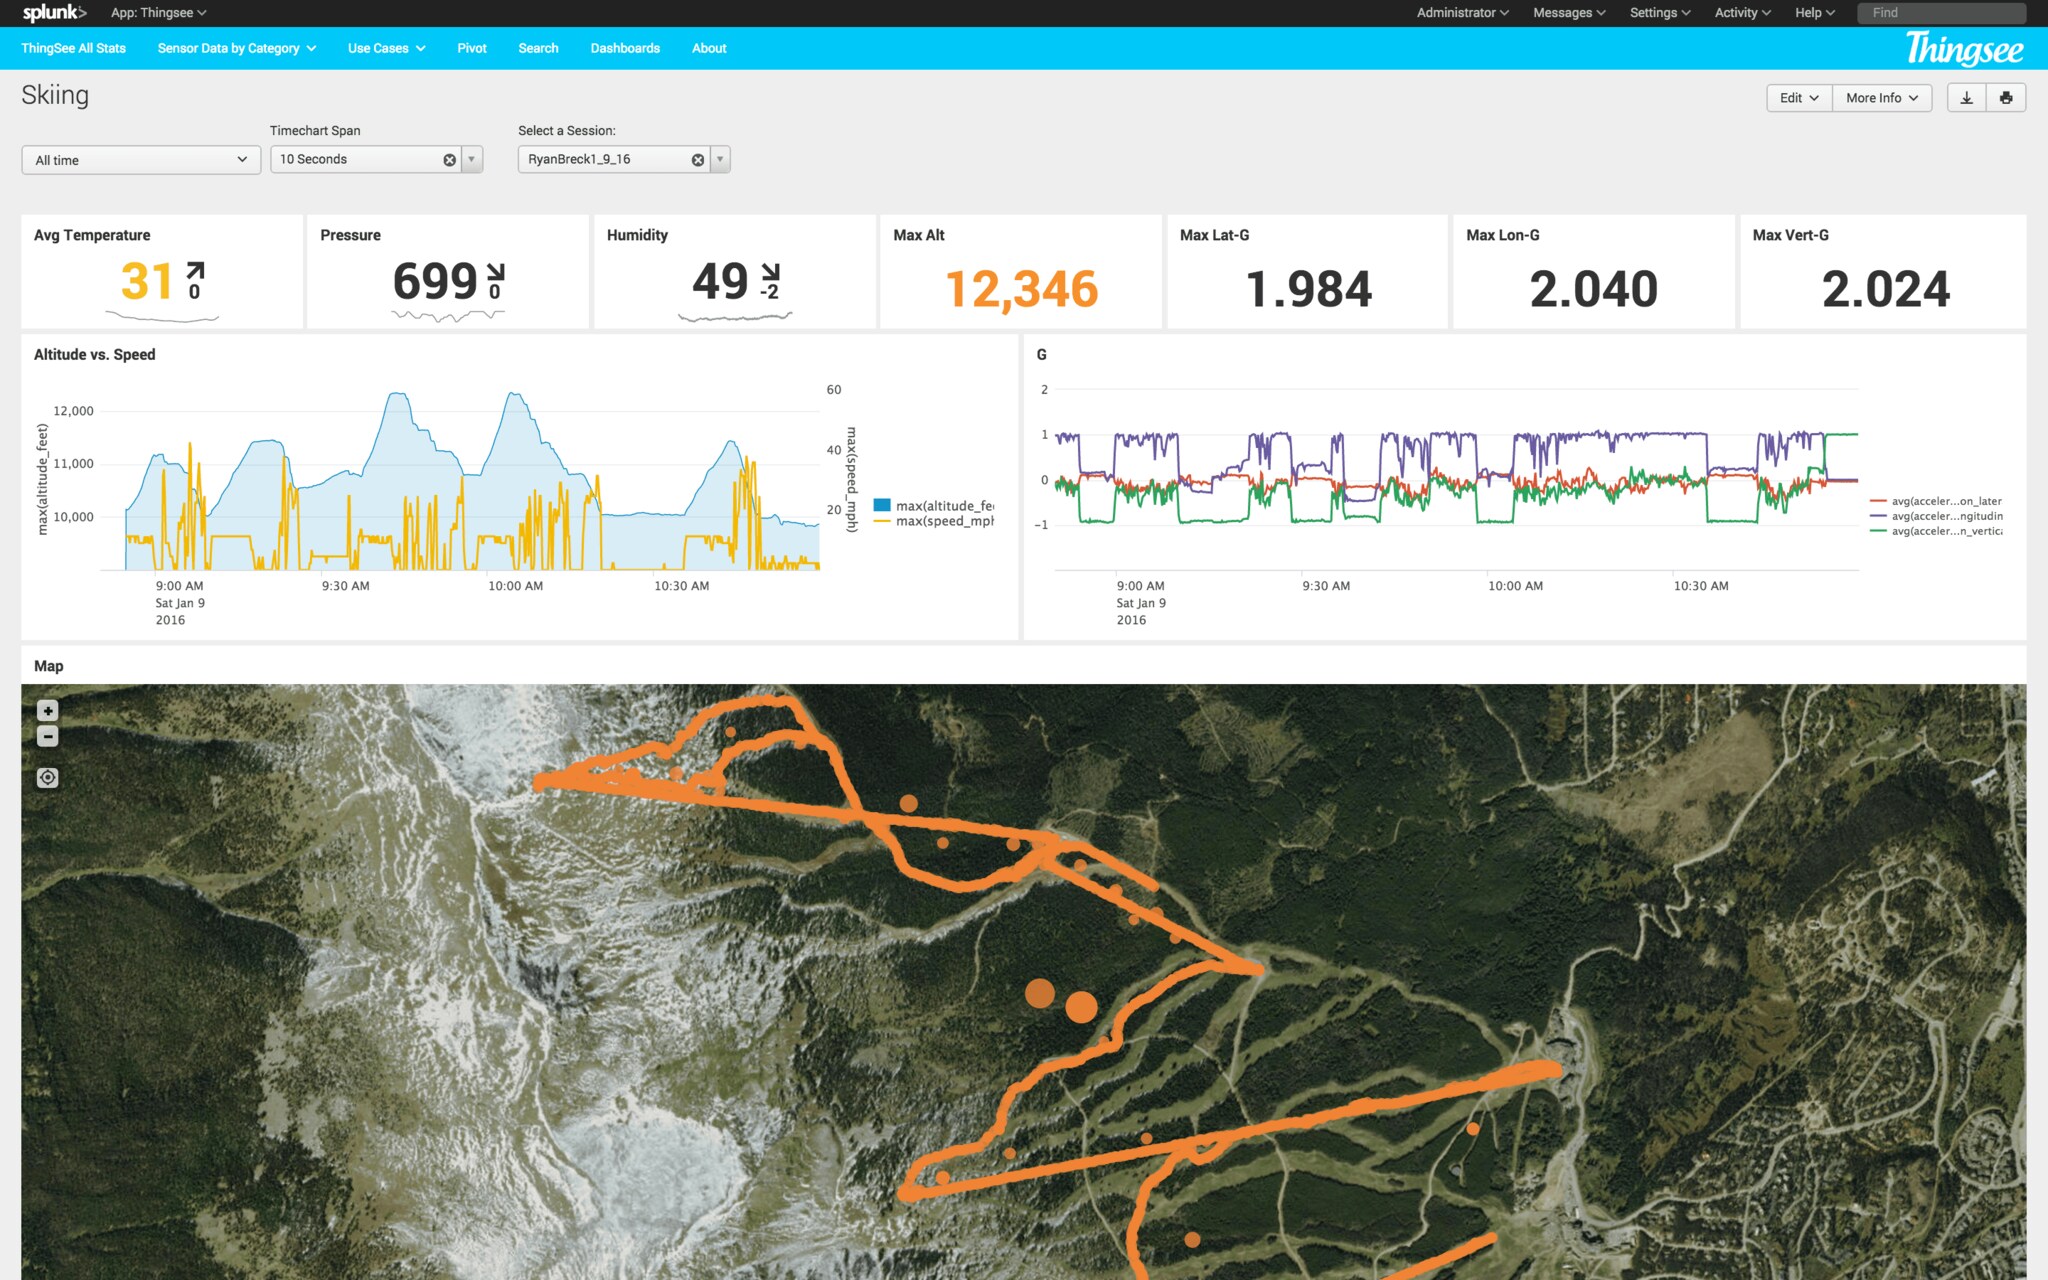
On to some dashboards. Again, it’s not avalanche data (maybe I’ll be able to do this in the future though!), but it’s still fun and interesting. Basically, I carried a Thingsee with me and Splunked the output while I was doing the avalanche course. Read this Blog for details on the Thingsee, but the device basically records things like impact, speed, temperature, humidity, air pressure, gps and a few other things.
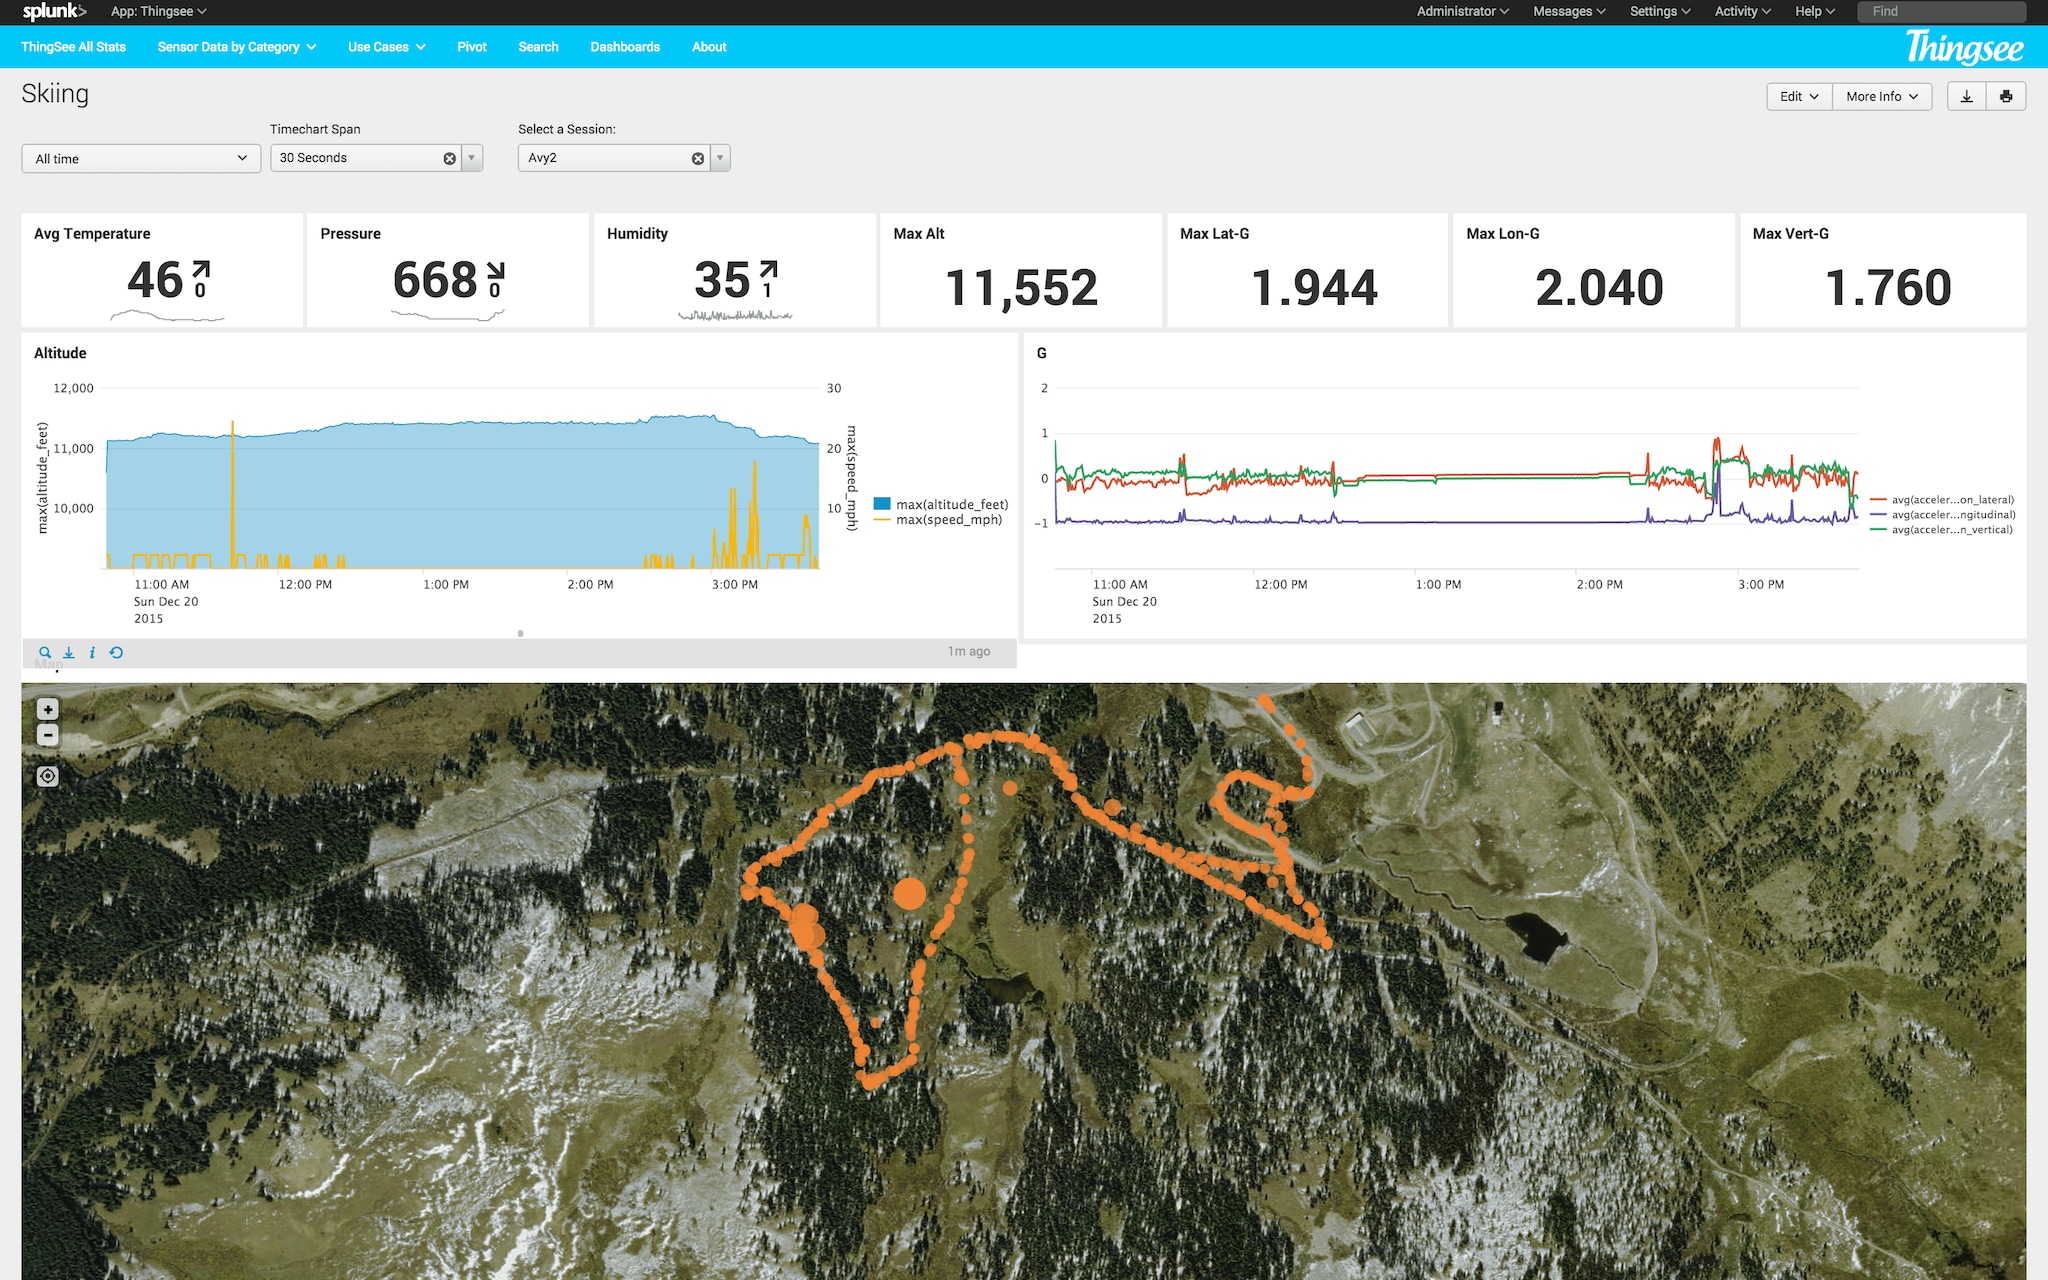
Here was the data from the avalanche training course over a few hours. You can see how slow our elevation gain was skinning up the mountain to our training spot. At least it wasn’t too cold out. Additionally you can see where I went, what the altitude was, and speed going down. Since it was a training day and we weren’t on anything too steep it was difficult to go my preferred 50+ mph on the way down ;). Additionally, you can tell from the gyrometer data when the Thingsee was just laying around.
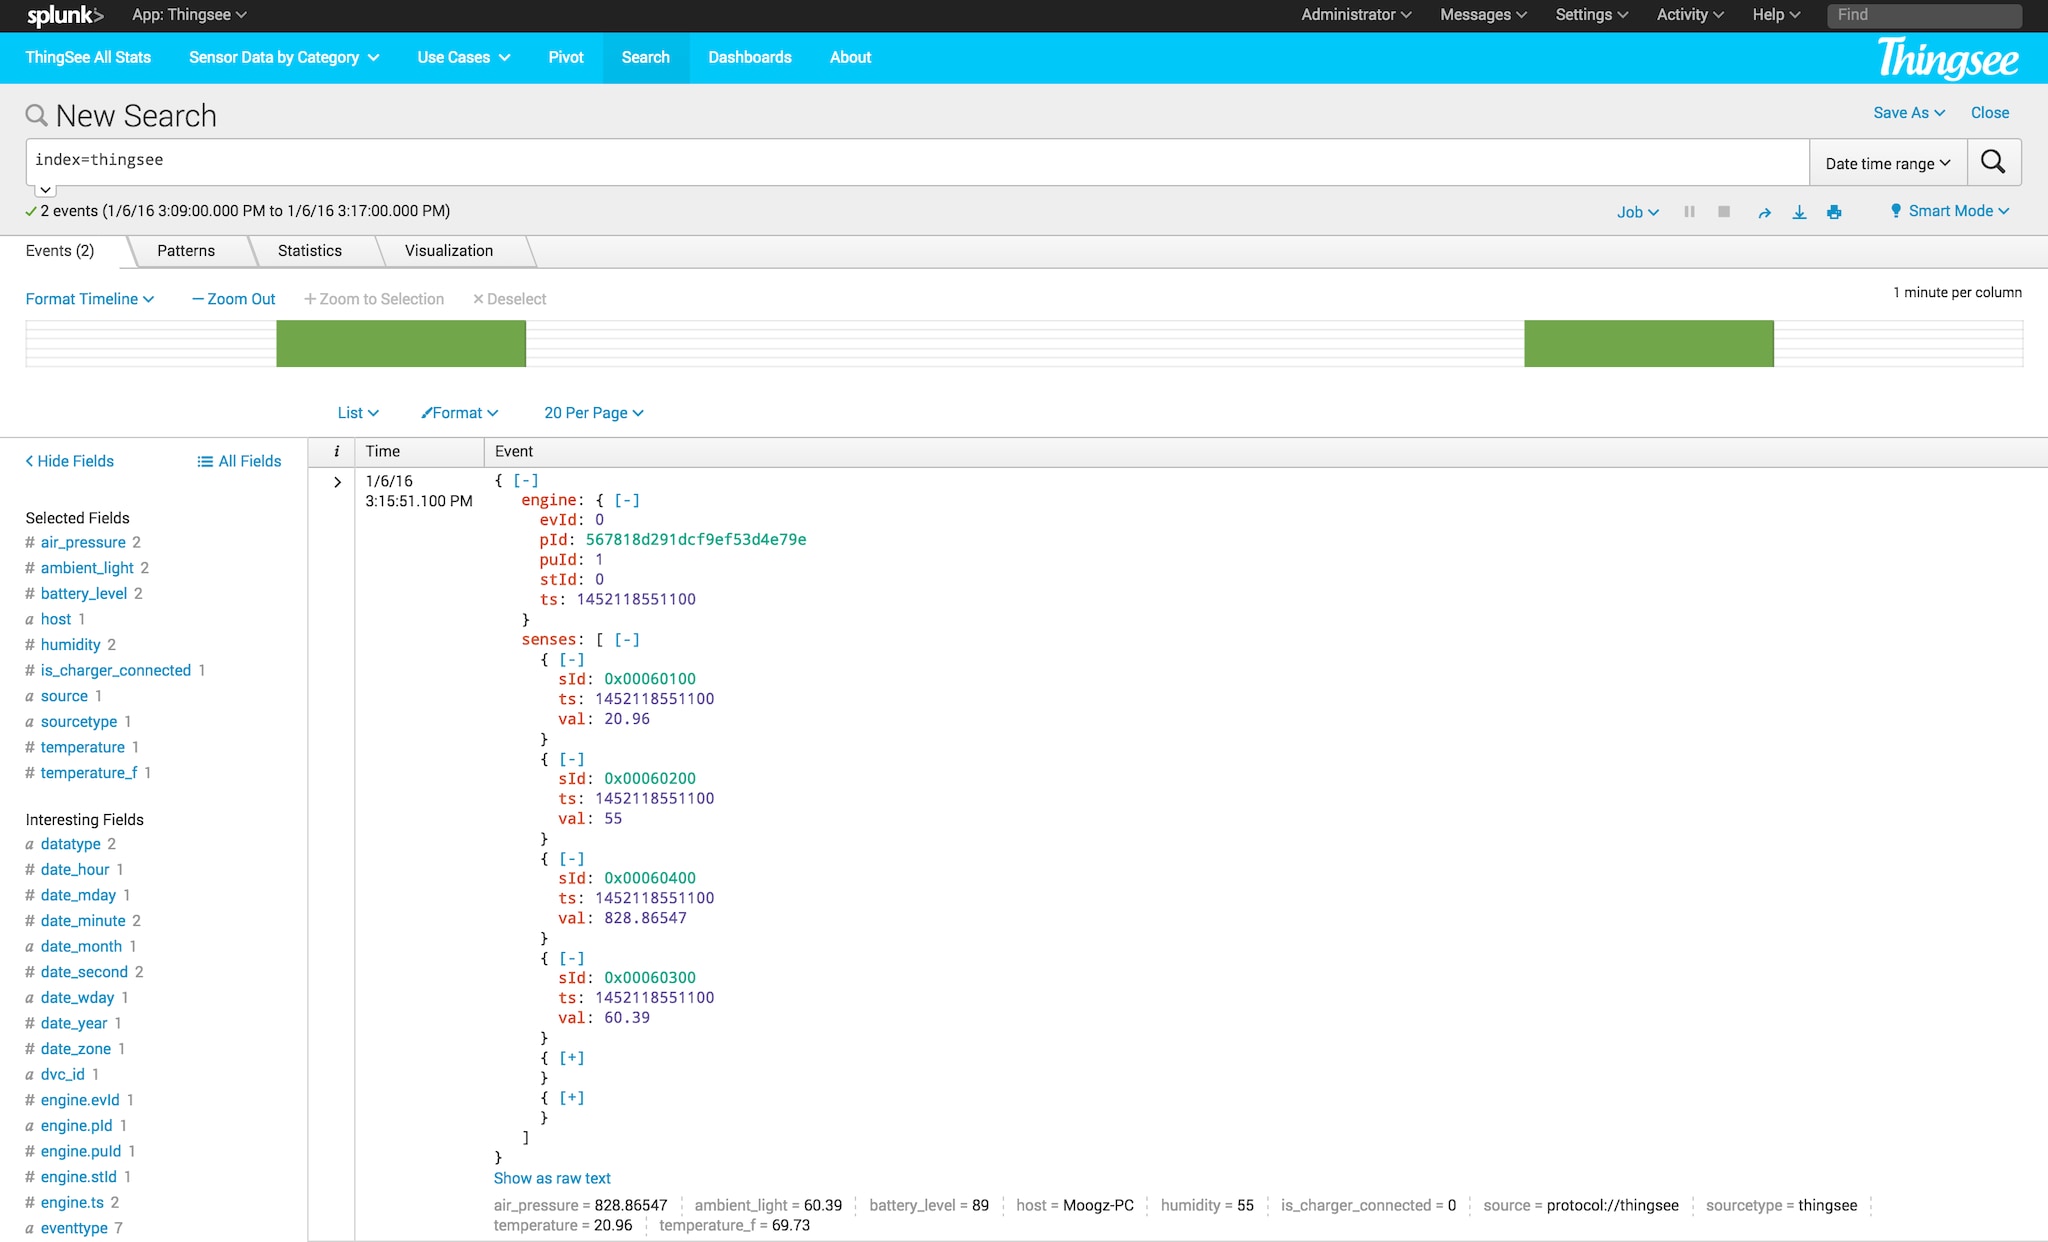
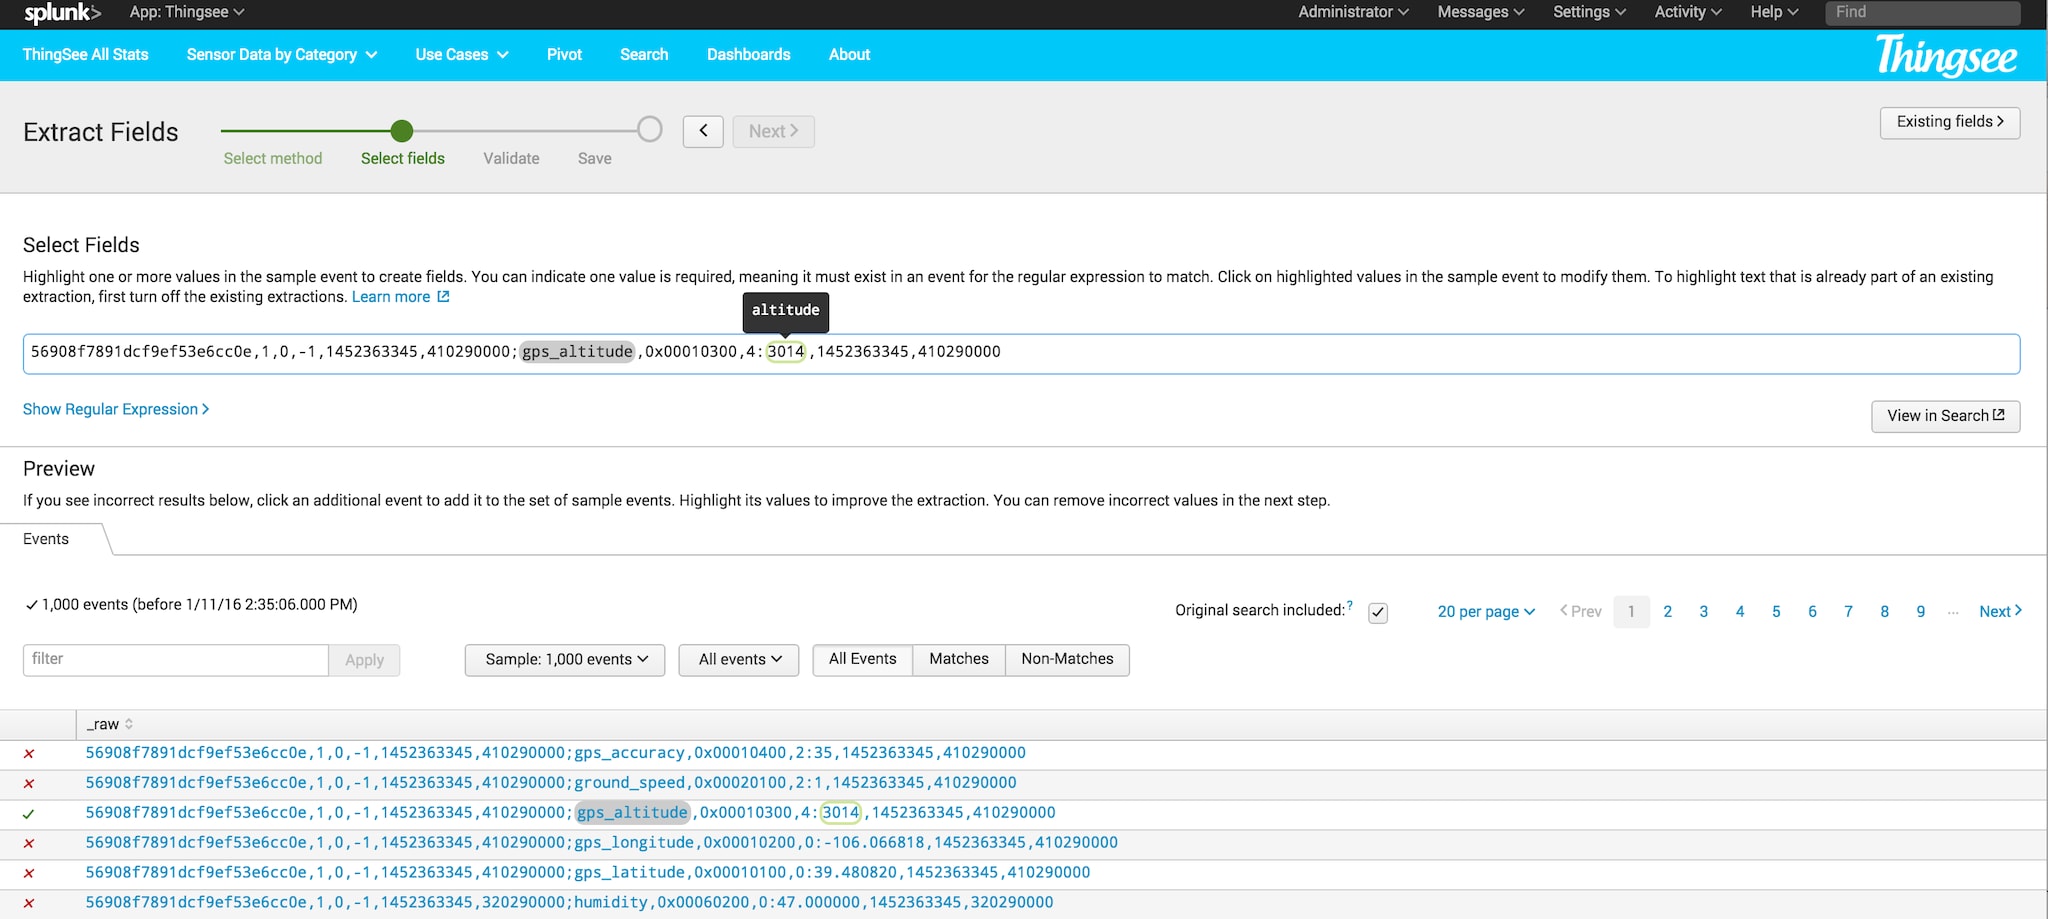
What does this data look like? The Thingsee actually outputs data in two different formats depending on if you are sending it to a server real-time or logging directly to the device. With Splunk’s schema on the fly I was able to extract fields from both data sets and build analytics as if it were one dataset.
Real-time data comes in as JSON.
Whereas logged data comes in as it’s own log format.
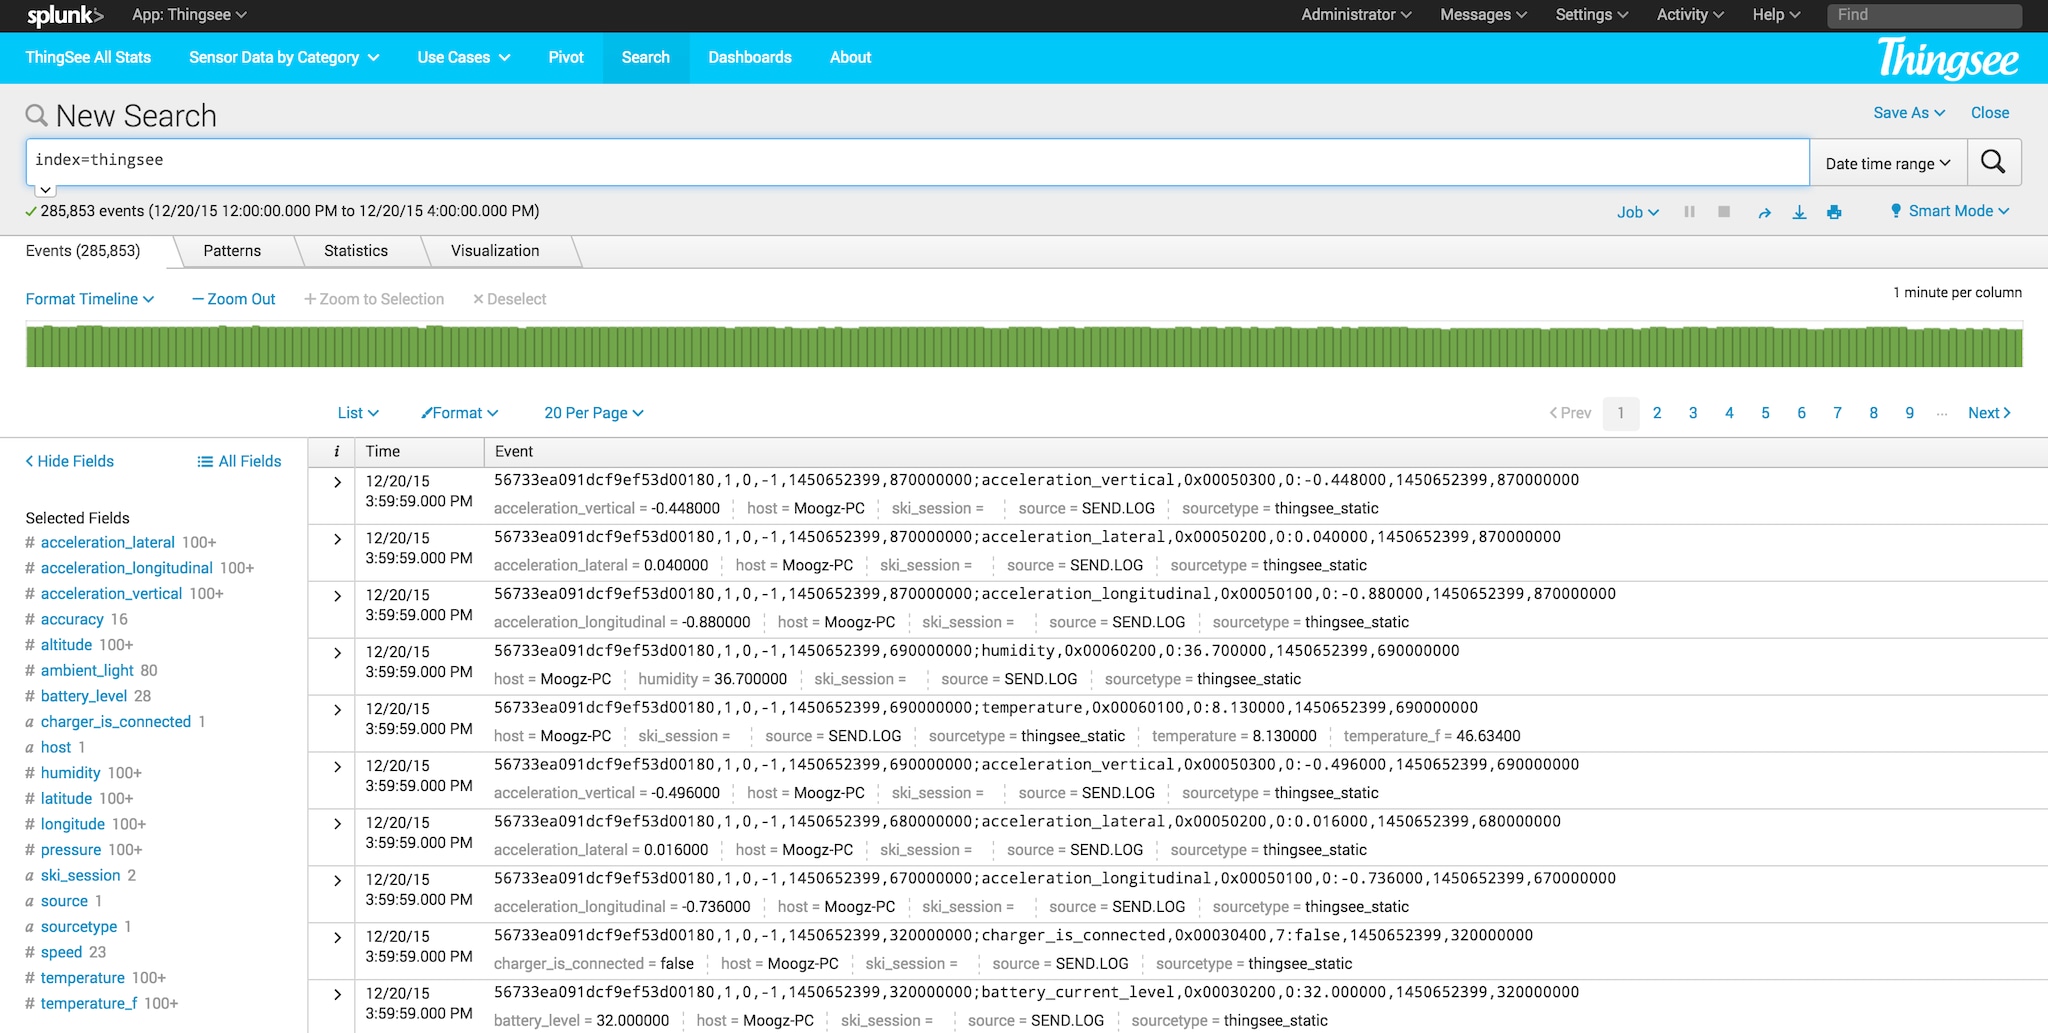
The Thingsee App for Splunk came with field extractions for the JSON, but I had to create my own for the logged data. Piece of cake using the advanced field extractor! Just highlight some text!
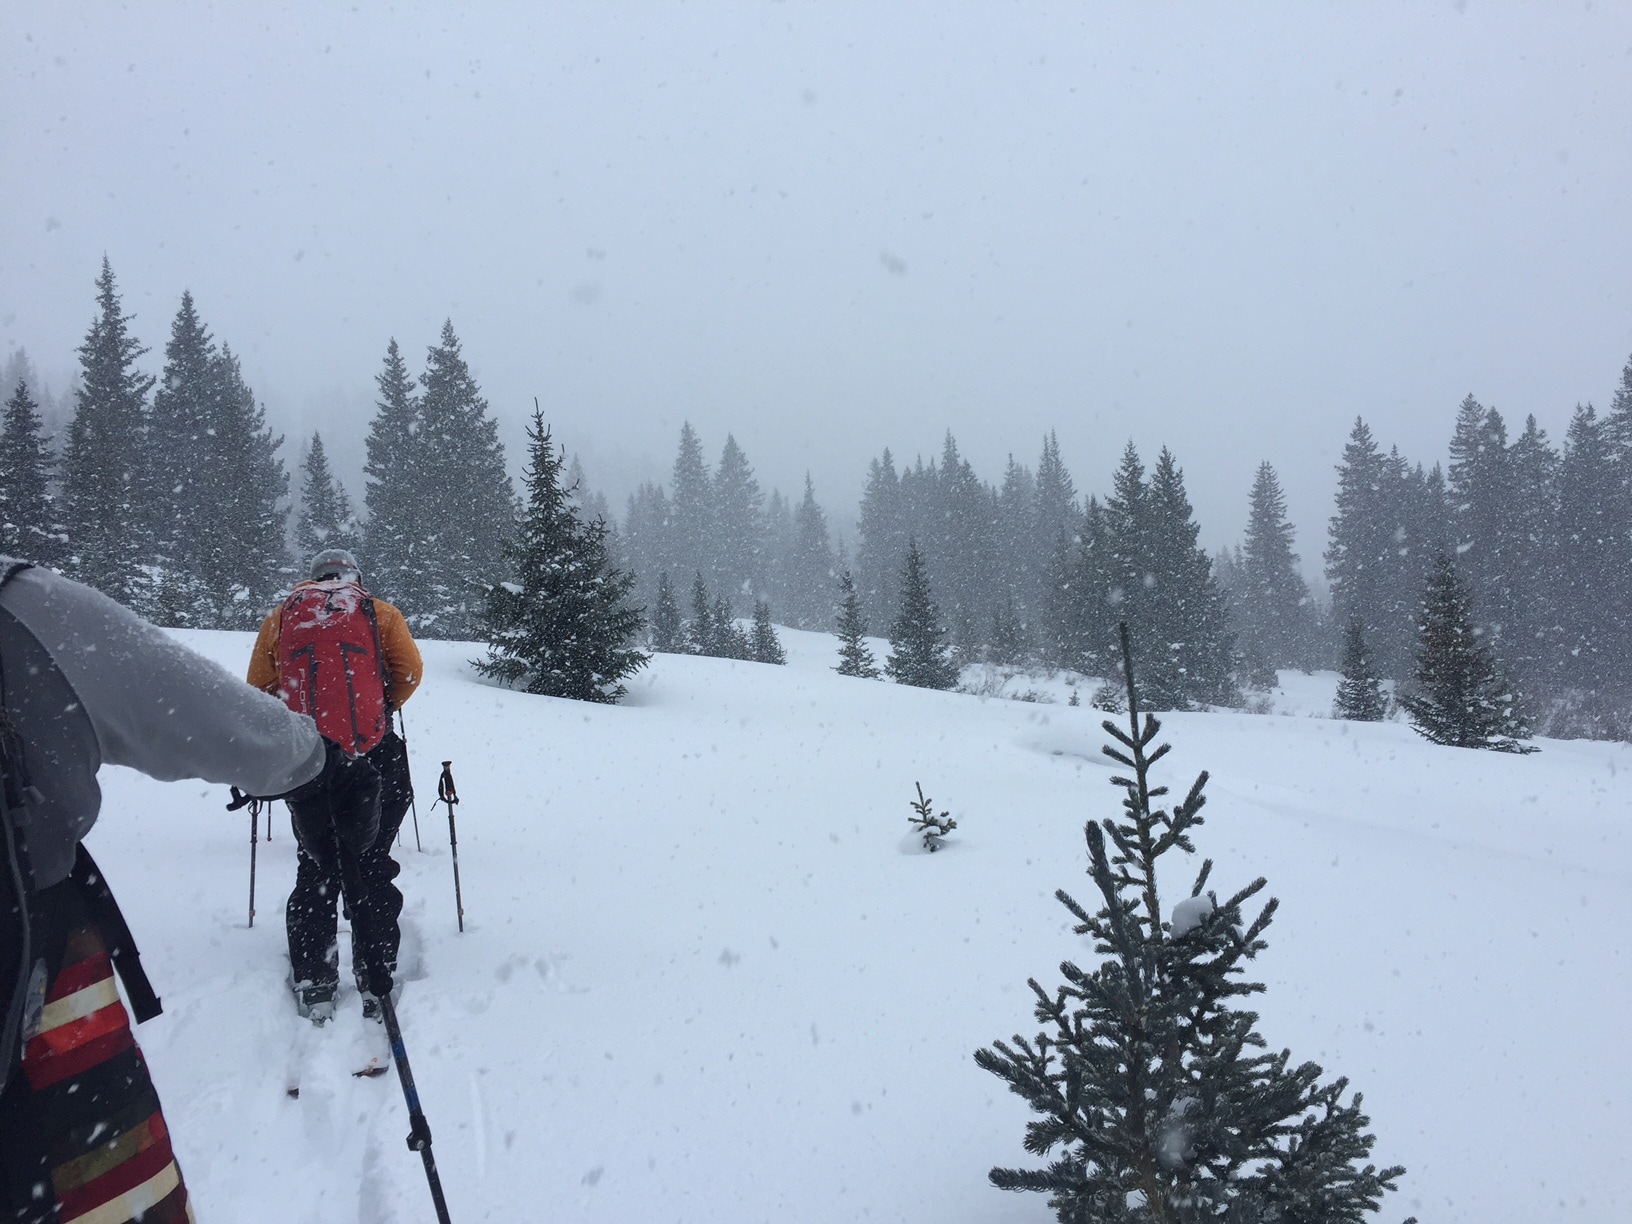
Oh and here are a few pics from the avy day:
Skinning through the backcountry …
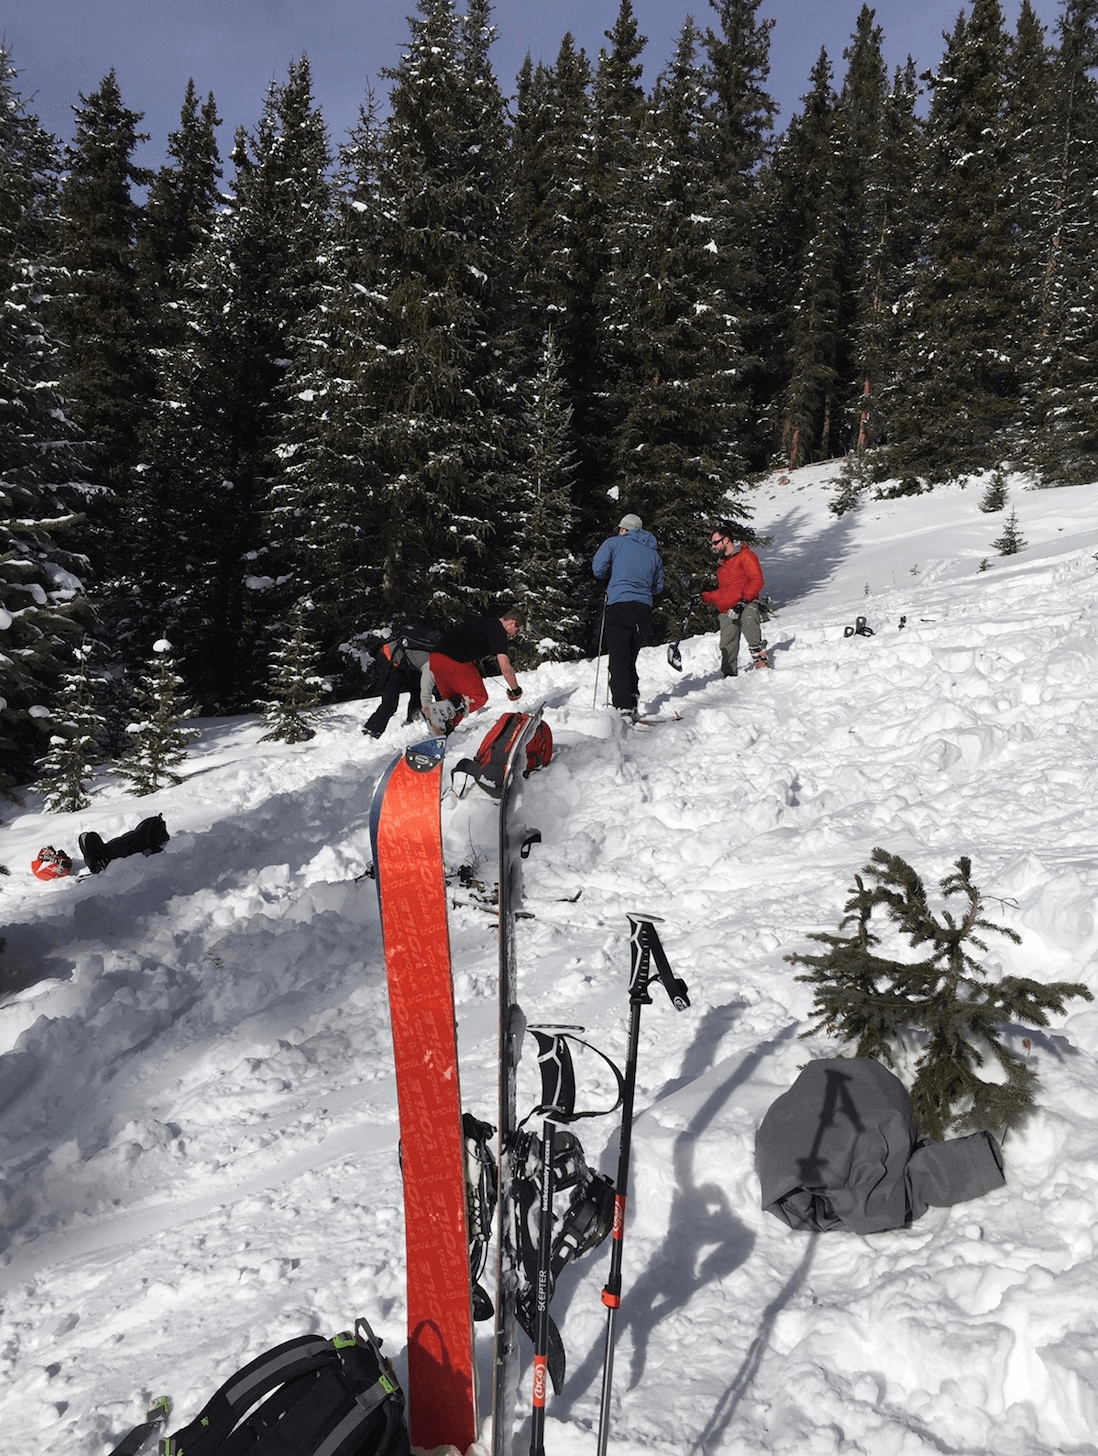
… and Beacon finding training:
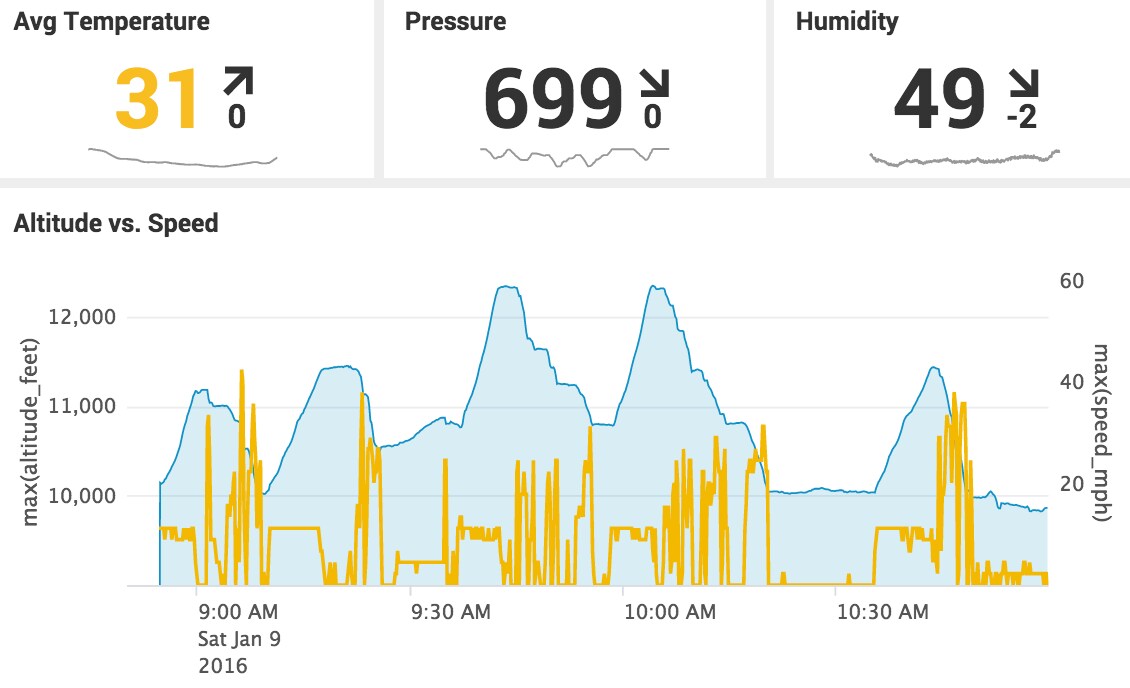
How about a few more dashboards. Here are a few hours at Breckenridge, CO. Nothing extreme as I was with the family, but you can see some differences in the data compared to the backcountry skiing day. Can you tell when I was riding the ski lift from the gyro data, speed?
Ok back to Avalanches…
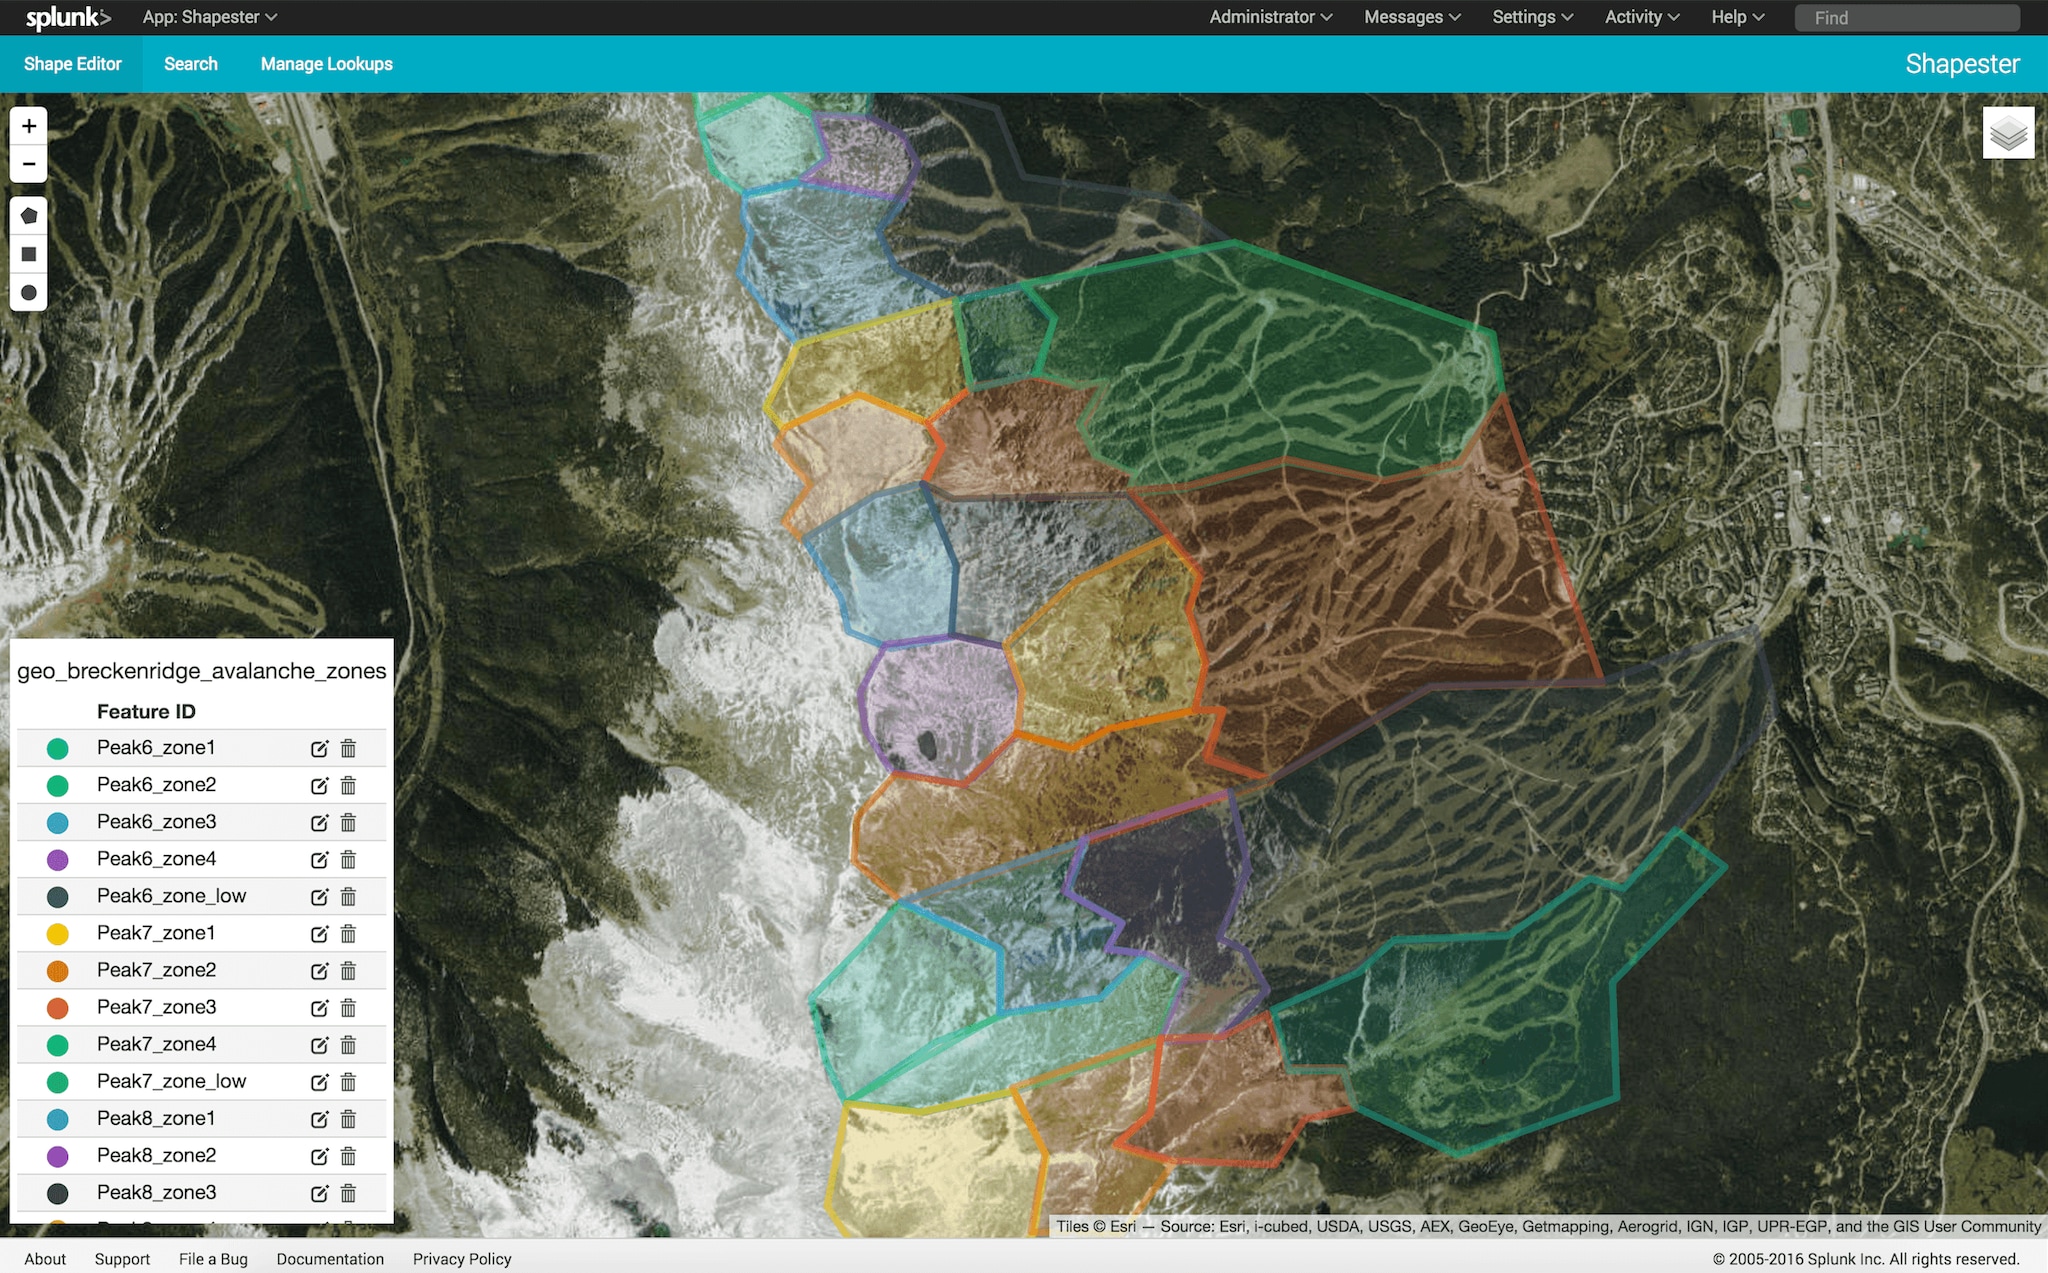
What if I did have some avalanche sensor data? What might it look like? I used a free app from Splunkbase called Shapester to build a grid over Breckenridge (yes it’s not backcountry but resorts have safety to worry about too!) and simulated data to populate the visualization. What if the resort could monitor in real-time the avalanche danger, how many patrols have been made and how many avalanche control blasts have been executed in specific zones over time in the resort? I could keep asking questions.. and Splunk could answer them, all without me writing one single line of code.
Creation of a polygon set for theoretical avalanche zones in Shapester:
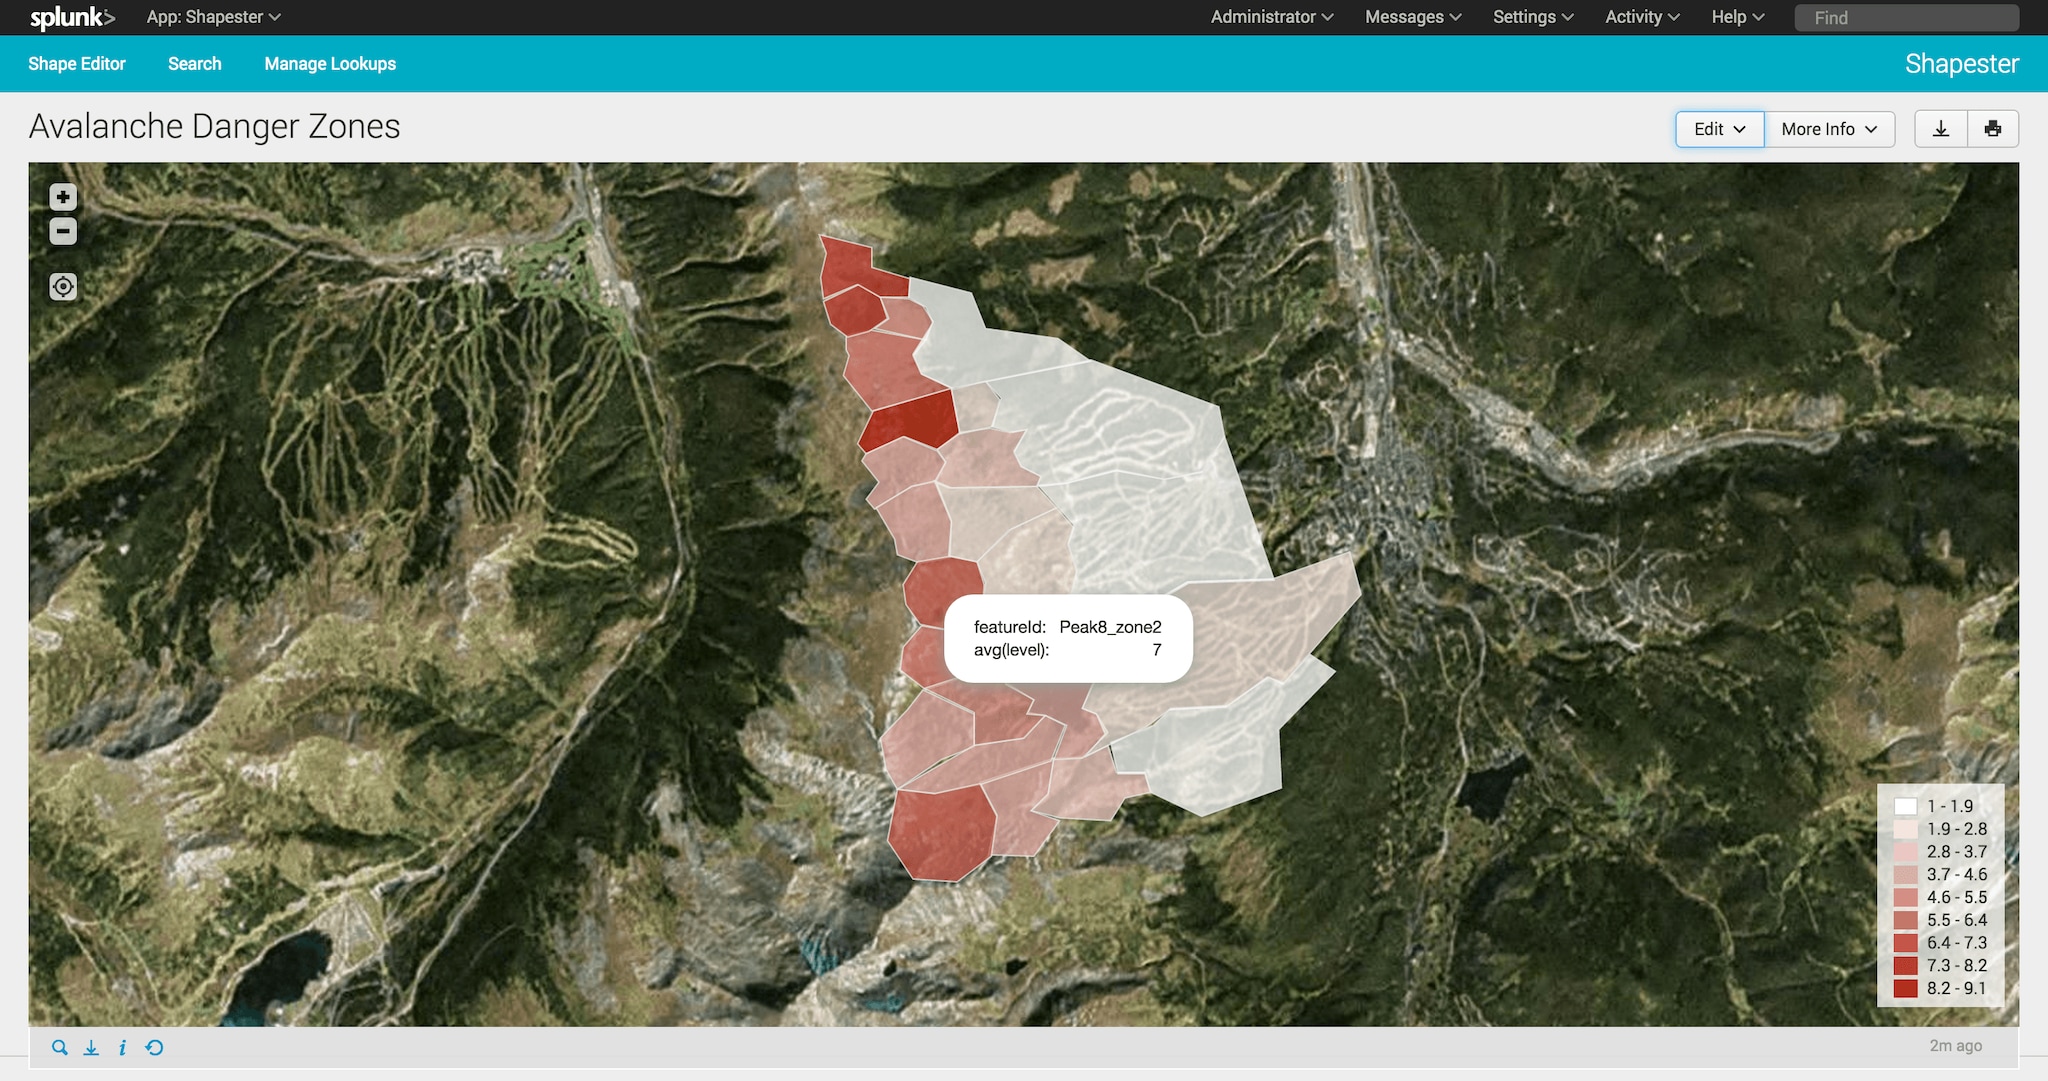
Adding simulated data to show avalanche danger by zone as a result. And now I could simply add this as another panel to any of the dashboards I created! Please note this does not represent actual zones designated by Breckenridge!
Collecting the ski data from the thingsee was indeed fun, but after learning how to read conditions from avalanche forecasts, current and past weather, writing results down manually with a pencil, using my beacon, shovel and probe, and finally skiing some awesome “gnar pow” (if you don’t know what this means try a Google search), I again was left asking the following question. How can data improve this field? If this weekend taught me anything it is that avalanche safety is about collecting information, putting it all together and making a collective, informed decision of whether or not to ski a certain terrain. Could this be made easier and more accurate? And what how about real-time insight? Could we use Machine Learning to better predict the possibility of an avalanche? Can we make avalanche rescue more effective and save lives? How many data sources can we mesh together to help predict dangerous terrain? How will data become part of the landscape? Nature can be quite unfriendly and won’t hesitate to end us, but what if we could improve our chances by even 1%? Would you take an extra 1% to survive?
Hope you enjoyed the post, and would love to see comments and ideas! Happy Splunking! And Skiing!
For some more information on Avalanche prediction and information in Colorado check out the Colorado Avalanche Information Center (CAIC). I usually check here almost daily to monitor conditions before I make any trip plans.
----------------------------------------------------
Thanks!
Stephen Luedtke

The Splunk platform removes the barriers between data and action, empowering observability, IT and security teams to ensure their organizations are secure, resilient and innovative.
Founded in 2003, Splunk is a global company — with over 7,500 employees, Splunkers have received over 1,020 patents to date and availability in 21 regions around the world — and offers an open, extensible data platform that supports shared data across any environment so that all teams in an organization can get end-to-end visibility, with context, for every interaction and business process. Build a strong data foundation with Splunk.

Get the latest articles from Splunk straight to your inbox.
© 2005 - 2024 Splunk Inc. All rights reserved.
