
Digital Resilience Pays Off
Download this e-book to learn about the role of Digital Resilience across enterprises.
Recently, after working with a Business Team and the Technical Team that supports them at one of our customers, we had an opportunity to witness, first-hand, the struggles each of us in IT Operations has felt at some point. In the words of a wise man, they were experiencing “Mutual Mystification.” The Business Team was concerned with a Product Line and multiple business processes. The Technical Team was trying to translate the technical details of the underlying micro services and how they were related to the Product Line. Within the first 15 minutes, both teams were becoming frustrated and didn’t feel like they were communicating well. This led to a consensus that the meeting was not going to achieve the results both groups were expecting.
The groups understood that they were responsible for each other’s success, but were not sure how to come to an agreement. As another wise man said, “a picture is worth a thousand words.” We decided to show them an example, a picture of how the two teams might work together. Drum roll for the good stuff to come!
We brought the two teams back together, and introduced them to Splunk’s IT Service Intelligence (ITSI). They happened to be a financial institution, so we started with an example of how the business could see the details in “real time” for the indicators they were concerned about; Health of the Services, Revenue by Generation Point, and Interactions with the System (User Count). The Business Team said their VPs needed to be able to see these types of KPIs at all times.
Here is the example we used, the first of two Glass Table visualizations in ITSI:
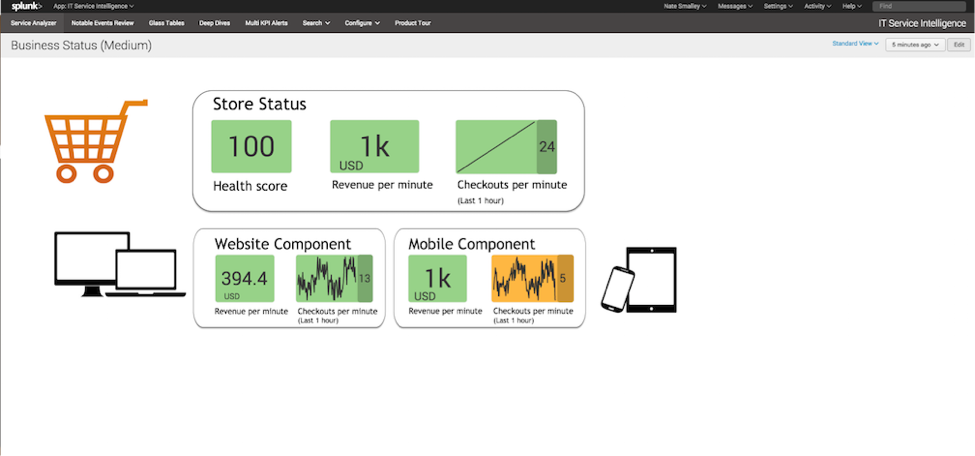
The Business Team was stoked! However, the Technical Team was full of questions, “How did Splunk get these numbers, what happens when they were not at a certain threshold, etc.?”
These questions (and many others not asked) were completely valid, however we answered their question by asking Technical Team what was really important to them? The team responded that their most important troubleshooting resource is network diagrams. We asked if they would be comfortable seeing the details in something like this?
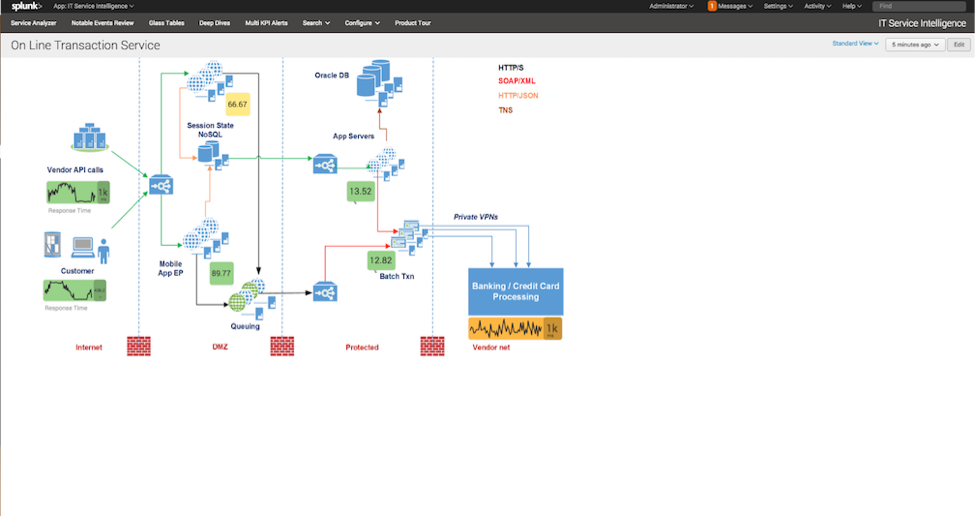
This launched another set of completely valid questions.
How was this service built?
What does (that component of the service) do?
Where do those components live?
Why does the service do that?
Before we could start to answer, individuals from both teams started to help answer each others questions using the respective visual examples as aides. ITSI had created a communication medium that allowed each team to acknowledge and understand what was most important to each other. More importantly, the two teams started co-developing the Key Performance Indicators they mutually thought were beneficial, as well as ones that only one group may use. Once they completed their list of top 10 KPI’s the teams asked, “How will this happen?”
As we explained to these teams, the flexibility of IT Service Intelligence is one of the primary benefits – the ability to take in the list of Entities (Hosts, Network Devices, just about any unique, well.. Entity) and use it to create those KPIs. We shared with each team how to create a KPI from their unique perspectives (spoiler – anything you can return in a Splunk search can be a KPI). The Technology Team wanted to see the individual Entity performance where as the Business Team only wanted to see the aggregates. Yup, we confirmed: this too can be done with Splunk’s IT Service Intelligence.
The last piece of the instructive session included the introduction of Adaptive Thresholding, which was really received well. We upped the ante just a bit by saying, “But wait! If you like that about IT Service Intelligence, you might also like that it includes Anomaly Detection!”
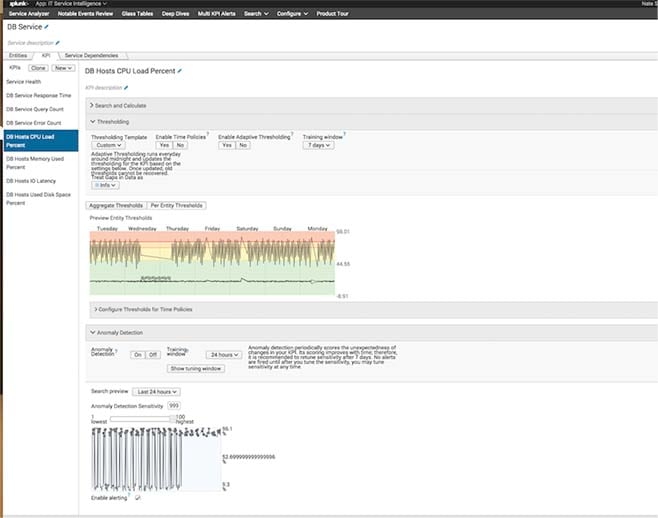
Why is this SO important?
As a Technologist, I leave you with a challenge to work with the teams that you are supporting. Take the time to see how similar the KPIs and Service Level Agreements between your Business and Technical groups really are. By all means spin up an IT Service Intelligence Test Drive to use as an example and leverage ITSI’s capabilities to showcase the four values above and see how the combined teams respond.
Happy Splunking!!!!
----------------------------------------------------
Thanks!
Nate Smalley

The Splunk platform removes the barriers between data and action, empowering observability, IT and security teams to ensure their organizations are secure, resilient and innovative.
Founded in 2003, Splunk is a global company — with over 7,500 employees, Splunkers have received over 1,020 patents to date and availability in 21 regions around the world — and offers an open, extensible data platform that supports shared data across any environment so that all teams in an organization can get end-to-end visibility, with context, for every interaction and business process. Build a strong data foundation with Splunk.

Get the latest articles from Splunk straight to your inbox.
© 2005 - 2024 Splunk Inc. All rights reserved.
