
Digital Resilience Pays Off
Download this e-book to learn about the role of Digital Resilience across enterprises.
Following John Mark’s recent blog on the posting from Andre Leibovici, I have been working with Andre to obtain a handful of PCoIP log files to build a sample Splunk PCoIP App. Splunk provides an incredible way of analyzing the vast amount of data, and provides a platform to translate these raw data into useful information for use as Operational Intelligence.
Once Splunk indexes the logs, it wasn’t too long before the PCoIP App was built. Splunk automatically extracts out the field extractions, and allow you to immediately report on fields that may interest you. From Andre’s blog, common fields would consist of:
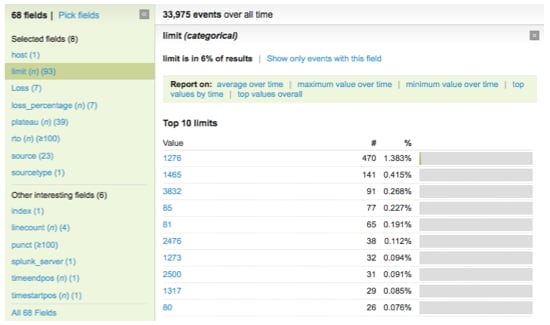
For example, if I want to know more information on the “bw_limit “over time, this field has already been extracted out by Splunk automatically under the field name “Limit”.
By issuing the next command “sourcetype=pcoip | timechart avg(limit)”, I was able to quickly get a graph that shows me the bw_limit over time.

Putting all these together, a PCoIP administrator would be able to use Splunk to build customized dashboards in a few mouse clicks to report on data such as:
The below shows a sample screenshot of the sample PCoIP App that was done, and you can download the App from our Splunkbase website.

----------------------------------------------------
Thanks!
Tat-Wee

The Splunk platform removes the barriers between data and action, empowering observability, IT and security teams to ensure their organizations are secure, resilient and innovative.
Founded in 2003, Splunk is a global company — with over 7,500 employees, Splunkers have received over 1,020 patents to date and availability in 21 regions around the world — and offers an open, extensible data platform that supports shared data across any environment so that all teams in an organization can get end-to-end visibility, with context, for every interaction and business process. Build a strong data foundation with Splunk.

Get the latest articles from Splunk straight to your inbox.
© 2005 - 2024 Splunk Inc. All rights reserved.
