
Digital Resilience Pays Off
Download this e-book to learn about the role of Digital Resilience across enterprises.

The football/soccer World Cup starts tonight and so here in the UK, the usual press and hype is building to fever “pitch” (apologies for the awful joke). The two questions everyone is asking are “can England get out of the group stage?” and “who’s going to win the World Cup?”.
English people already know how the World Cup will end, a disallowed goal probably followed by penalties which we’ll lose. Therefore, I thought I’d try and answer the second question of who is going to win the World Cup by analysing some data in Splunk.
World Cups 1930-2006
I started off looking at the historical data from the last 80 years or so of World Cup football. The first interesting trend is that the number of goals scored per World Cup is on a significant upward trend and you can see that below:
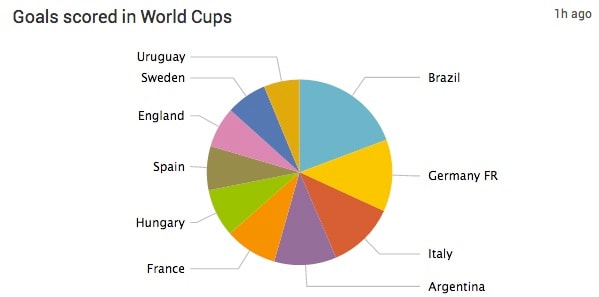
Over the last 80 or so years of World Cups – the data says Brazil have performed best (backed up by the fact they’ve won it more times than anyone else). They’ve scored the most goals:
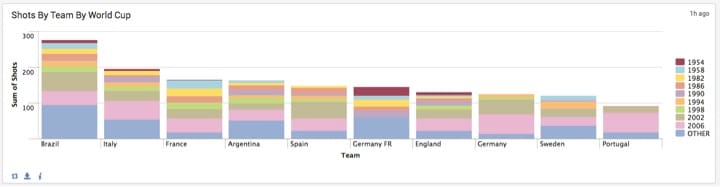
They’ve also had the most shots (the different colours represent the World Cup the goals were score in):

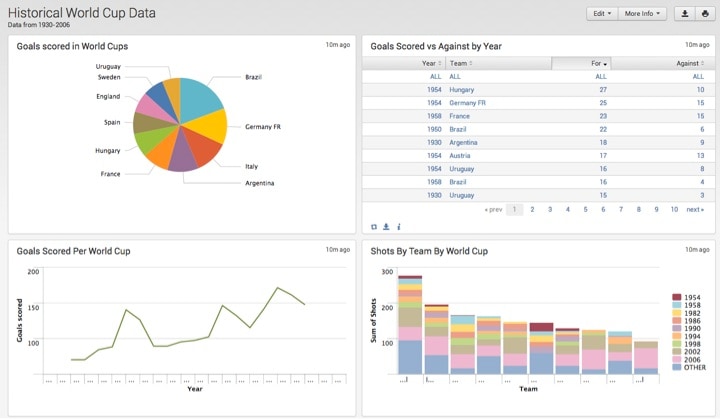
Interestingly – the most goals scored by any team in a single World Cup is Hungary who scored 27 goals in 1954. You can see that from the pivot table below:
I put all the historical data on a dashboard before going on to round 2:
World Cup 2010
After analysing all the historical data from 1930-2006, I decided to have a deeper look at the last World Cup in 2010. The Guardian newspaper has a pretty extensive data set for 2010. I took the data for 2010, dropped it into Splunk and started by creating a pivot for Goals Scored vs Conceded Goals vs Shots. This gave me the following visualization:
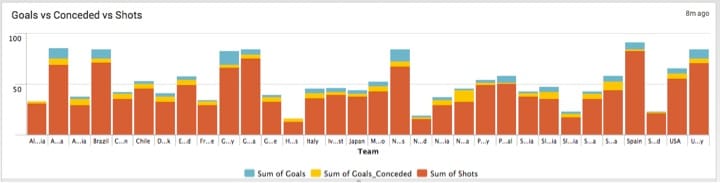
This gives me the top teams of Argentina, Brazil, Germany, The Netherlands, Spain and Uruguay (Ghana had a lot of shots but not so many goals scored).
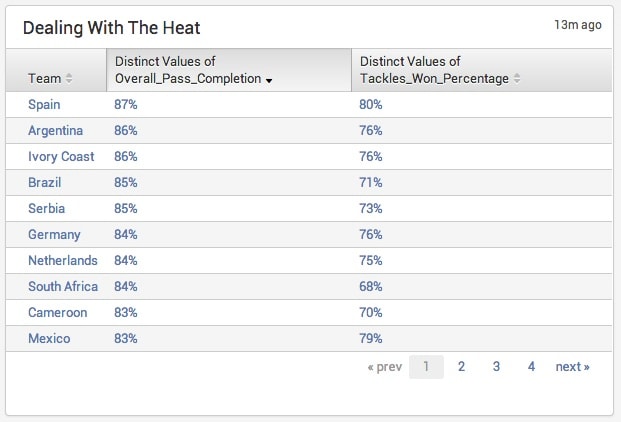
There’s been a lot of discussion about how the heat in Brazil is going to play a deciding factor in who’s going to win. Based on that, you don’t want to be spending all your time running around chasing the ball if the opposition have it. That got me looking at the passes completed and tackles won. The theory being, if you’ve got the ball and are good at getting it back, your team isn’t running around like a headless chicken getting hot, tired and dehydrated. I created a new pivot table showing which team had the highest completed passes and tackles won. Top of that table were Spain with the highest completed pass ratio and one of the highest tackles won. Argentina were second. You can see the results in the table below:
Last up I thought about the discipline – which teams are most likely to have players sent off or yellow-carded during the game. This may well have added impact with the temperature being so high.
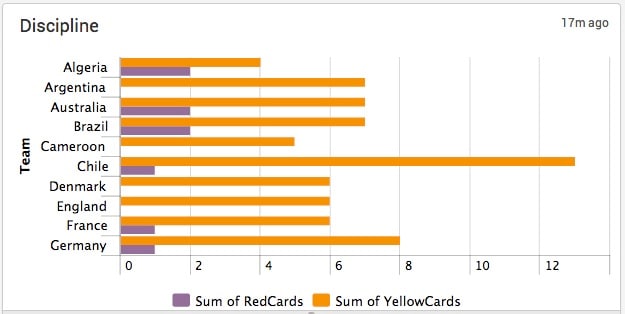
Of the top teams of Argentina, Brazil, Germany, Netherlands, Spain and Uruguay – Brazil and Germany had the worst record for red and yellow cards. Argentina didn’t get anyone sent off but had quite a few yellow cards. You can see the worst disciplinary records from the 2010 World Cup:
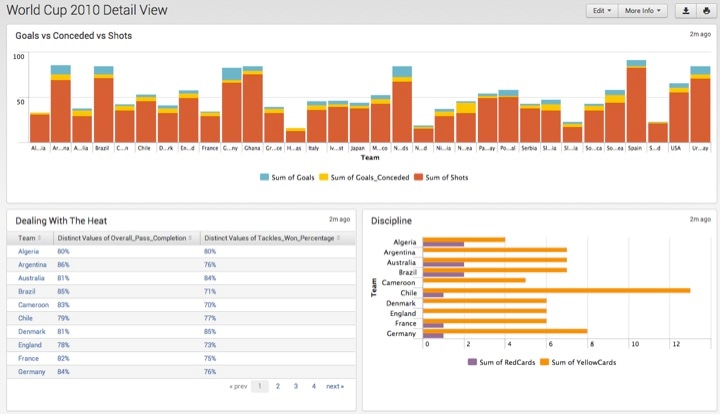
I put all of these visualizations together on a World Cup 2010 dashboard that you can see below:
Putting it all together – I’m going for Spain vs Brazil final. The historical data says Brazil, the data from the last World Cup says Spain.
A lot of people are saying Brazil will win but from the data, Spain are great at keeping the ball, getting it back, keeping their discipline and scoring goals without conceding many – all important factors in the heat (and it isn’t exactly cold in Spain).
Don’t use my analysis to go and place a huge bet. Firstly I’m not a football expert and secondly – there’s a lot more analysis you could do on this data. There are lots of data sets out there. Download Splunk here and have a play with the data yourself – let me know what you find out and your predictions in the comments below.
Enjoy the World Cup!
----------------------------------------------------
Thanks!
Matt Davies

The Splunk platform removes the barriers between data and action, empowering observability, IT and security teams to ensure their organizations are secure, resilient and innovative.
Founded in 2003, Splunk is a global company — with over 7,500 employees, Splunkers have received over 1,020 patents to date and availability in 21 regions around the world — and offers an open, extensible data platform that supports shared data across any environment so that all teams in an organization can get end-to-end visibility, with context, for every interaction and business process. Build a strong data foundation with Splunk.

Get the latest articles from Splunk straight to your inbox.
© 2005 - 2024 Splunk Inc. All rights reserved.
