From Novice to Senior: How an MCP-Enabled Capture Appliance Changes Threat Hunting
Security Richard MarshKey takeaways
- Giving AI agents a code sandbox to analyze network packets worked perfectly every time and cost far less than dumping raw packet data directly into the AI's memory.
- A misconfigured security camera was found leaking live images hidden inside encrypted telemetry data, discovered only through full packet capture analysis.
- AI agents can now help junior analysts perform advanced network investigations once reserved for senior experts, while humans still review and approve all final decisions.
With Anantha Srinivasan and Arunachalam Ganesan
Packet analysis is a dark art, taught by wizards and passed down to padawans. Learning it can be grueling and unforgiving. Some security professionals love this part of the job. Just as many can’t stand it.
There’s a reason it carries that reputation. Every Agentic Security Operations Center (SOC) needs to detect and respond to threats at machine speed with ground truth behind it. Splunk is the source of truth in the .conf26 Agentic SOC for network metadata: signature-based detections, network logs, conversation history. But what about the full context of that conversation? And what happens when there’s no signature yet for an emergent threat?
Packet capture is the missing piece in many SOCs. Packet capture data provides ground truth: an undeniable record of exactly what was communicated between hosts. It lets analysts rewind the clock on network activity based on primary packet data to confirm detection alerts and, most importantly, conduct threat hunting.
At the .conf26 agentic SOC, we had analysts from across the full experience spectrum: some with more than ten years in the seat, others walking into a SOC for the first time at the conference, and others in between. Splunk’s and Endace’s Model Context Protocol hosts (MCPs) are what let all of them work the same way, moving between Splunk and Endace without a human having to relay context between consoles. But wiring an MCP server onto a capture appliance doesn’t automatically make an agent good at packet forensics. Packet Capture (PCAP) analysis is arguably the least automatable skill in the SOC. The reason lies in the fundamental nature of wire data: PCAP is the unparsed raw data of the network, and how you expose it to a model decides whether the result is a shortcut or a liability.
Junior analysts who don’t know PCAP analysis yet can use Splunk’s and Endace’s MCPs to confirm ground truth the moment a detection fires. They pivot from logs and machine data in Splunk straight into live network traffic in Endace, so a theory gets tested in minutes instead of hours.
For the veteran packet hunters, ground truth was never the hard part. Speed is. We still verify findings by hand and question the AI’s analysis for possible hallucinations, but we’re doing it at a pace that wasn’t possible before.
This post covers what we learned implementing that AI within the SOC:
- How can AI collapse the skills gap between a novice and a senior analyst?
- How to build your AI solution so an agent doesn’t burn through its token budget or confidently hand you the wrong answer?!
We’ll answer both those questions, referencing a real scenario from Splunk .conf26: a misconfigured security camera leaking live images encoded as health telemetry.
Zero-Day Threat Hunting
Most of what closes the gap between novice and expert in a SOC comes from Splunk itself. A detection rule or a well-built dashboard encodes a senior analyst’s judgment. Splunk’s MCP carries that judgment even further: an agent can pull the right correlations, the right prior investigations, and the right context, without a human needing to know where to look first.
Packet capture resisted that pattern for years and not because logs are the weaker signal. Metadata tells you what a system observed. Full packet capture tells you what actually crossed the wire. Reading the packet data requires knowing which filter to write to find the relevant packets, knowing which protocol quirks explain what you’re looking at, and recognizing when the traffic in front of you doesn’t match any protocol you were ever taught to expect. The gap only closes when an analyst, or an agent, can move between both metadata and full packet evidence with the same instincts a senior threat hunter or SOC analyst has.
A junior analyst handed a raw PCAP for a DNS exfiltration alert will, naively, run tshark --export-objects or point Zeek’s File Analysis Framework at it, expecting a carved file. They’ll get nothing. Not because the tool is broken. DNS was never a file transfer protocol to these tools in the first place. Knowing that gap exists, and knowing you need a custom carve instead, is exactly the kind of pattern matching skill that takes years to build. There’s a name for that skill: zero-day threat hunting, writing the detection logic yourself when nothing already existing flags the behavior. It’s also exactly the kind of pattern matching an agent can be given directly, if the MCP layer is built to let it act instead of just look.
Splunk MCP
Splunk’s MCP surface starts inside Mission Control, the same investigation workspace an analyst already works from. An agent can open an investigation, link the findings that belong to it, and write its own steps back as notes, so the record left behind reads the same whether a human or an agent did the work. It can pull a response plan’s phases and tasks to work an investigation the way the team already agreed to work one, instead of improvising a process from scratch. None of this replaces the analyst’s decision. It means the agent’s activity becomes part of the same case history a senior analyst already reviews, not a separate transcript living outside it.
Inside that same investigation, the actual analysis runs using Splunk Processing Language (SPL). SPL search runs a query directly, so an agent can pull events, correlate fields, and build a timeline instead of asking a human to run it and paste the results back. SPL knowledge objects surfaces the saved searches, lookups, and detections that already exist for an environment, so an agent inherits institutional context instead of guessing it from scratch. Underneath both of those, the AI Assistant can turn a plain language question into SPL, explain what an existing query does, and optimize a slow query.
So, writing correct SPL stops being the bottleneck between an analyst’s question and an answer. Access still runs through Splunk’s existing role-based access control, so an agent only sees and runs what the analyst behind it is already allowed to see and run. That’s what makes it safe to hand a junior analyst’s agent the same access a ten-year veteran human analyst has inside Splunk: the ceiling on what the agent can do is already set by the platform, not by the agent’s judgment.
Endace MCP
The Endace Appliance’s MCP surface is deliberately narrow. Tools such as decode and search take in the parameters an analyst already uses - source and destination IP, time window, and ports. They return match statistics and a download URL for the relevant packet data. That slice lands in a sandbox with tshark, Zeek, and Python already installed, where the agent runs whatever code the case requires. Nothing else about the full packet capture is exposed to the model directly. The only things that ever cross into context are the small findings the agent’s code produces. That narrowness is the point. It keeps the architecture flat with respect to token usage, and it lets the Endace Appliance do the heavy lifting on packet filtering before any code runs at all.
Case Study: Images Pulled From a Misconfigured Security Camera
The alert here didn’t come from anything exotic. At every Cisco conference, the SOC deployment runs a standing Zeek-based detection for plaintext protocol usage. And at conf26, it caught exactly what it was built to catch: an enterprise smart security camera system sending its telemetry over MQTT with no TLS, in plaintext, readable by anything else on the segment. On its own, that’s a straightforward misconfiguration: identifying a device class that shouldn’t be broadcasting anything in the open doing exactly that.
If all the SOC had was network metadata, the investigation would stop right here. The detection already told the story: a device was talking plaintext MQTT, no TLS, visible to anything on the segment. There’s nothing else in a flow record or a connection log that would prompt anyone to keep digging. Closing the finding as a straightforward misconfiguration would be the correct call. However, having access to full packet capture is what turns that same alert into an open question instead of a closed one. The payload itself is available to be read.
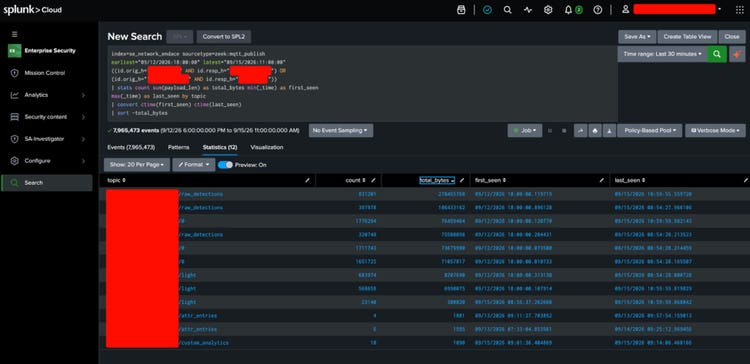
The Endace Appliance was holding 22 TB of full packet capture. Its MCP search tool, filtered to the camera subnet’s IPs over a 36-hour window, narrowed that down to ~675 MB, the slice that actually reached the sandbox. Everything else in that 22 TB never left the appliance, was never downloaded, and never came near the model. At that scale, the search primitive isn’t an optimization. It’s the only reason an agent can operate against a capture this size at all.

A SOC analyst pulled the full packet capture for the camera subnet and, through the appliance’s MCP search tool, handed the sandbox the relevant slice. That’s where the finding got more interesting: the camera’s telemetry wasn’t just status codes and heartbeats. Buried in its JSON payload, alongside device metadata, was image data. The vendor’s telemetry schema embedded still frames from the camera’s own feed as part of routine reporting.
No canned tool was built to know that. Three approaches got a shot at recovering the images:
The reassembled images became the evidence: proof of exactly what the camera had been capturing, and exactly how exposed it was. It’s the same pattern as any protocol carving gap: the canned tools see the traffic and even print the payload, but reconstruction needs custom logic built for that specific schema. With access to AI, that’s something a junior analyst can now do without years of MQTT internals and Zeek scripting experience behind them.
Tokenomics: Efficient PCAP Analysis
The first instinct any SOC analyst has today is the obvious one: load the PCAP into an AI assistant and ask it to slice and dice it. That instinct has a name. It’s “decode into context”, feeding the model a text dump of the packets and letting it reason over that text directly. We tested that instinct head-to-head against Endace’s search plus sandbox approach, where the agent calls tshark and Python natively instead of reading packet text at all.
Search plus sandbox is the architecture Endace’s MCP implements. The appliance’s search tool slices the relevant packets and hands the agent a download URL. The agent pulls that slice into a sandbox that can run tshark, Zeek, and Python, then runs whatever decode logic the case needs. Only a small findings summary crosses back into the model’s context: hashes, IOCs, file type.
Decode into context is where a text representation of the packets, such as the output of tshark -T ek -x, lands directly in the model’s context, whether an analyst pasted it in by hand or an AI assistant pulled it in automatically. The model must reason over that text itself, the same way it reasons over any other block of text in the prompt.
To put a real number on that instinct (instead of relying just a hunch) we ran a controlled experiment: reconstructing images encoded inside telemetry streams. That case works well as a benchmark because it has an exact, deterministic ground truth to meter tokens and dollars against. Canned tools carve nothing, custom code in a sandbox recovers the file exactly. The difference between the two approaches came out as a flat cost curve against one that blows through any context window.
Methodology*: we measured token usage and cost in two ways. First, we counted tokens directly. Every tool call’s returned text ran through the tiktoken* o200k_base tokenizer, summed step-by-step through the investigation, giving an exact count of what lands in the model’s context at each point, independent of any specific model.
Second, we ran both approaches as a live agent loop against Claude Opus 4.8 (cost $5 / $25 per million input/output tokens), with schema-constrained tool calling, three runs per approach, with the model not being given the encoding scheme in advance. That process metered real input (re-billed every turn), output, and dollar cost. The live run measured the minimum cost (cost floor). Provider-side hidden reasoning tokens aren’t observable through the completion API, so actual cost only goes up from here.
Caveat on scale: the full ~675 MB capture is impractical for decode-into-context to even attempt, so this comparison was scoped down to a single MQTT publish sequence within the PCAP ~2.8KB of packets for scenario #2. The projection curve shows what happens as that scales towards the actual capture size.
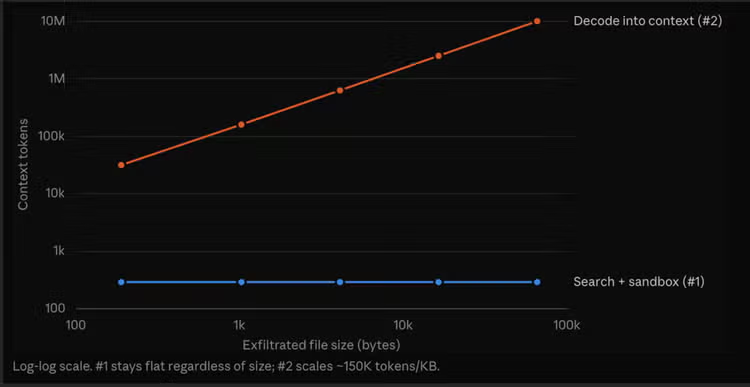
Endace’s search plus sandbox approach stays roughly flat at about 7,000 tokens no matter how much packet data moves through it, because the agent only ever sees the findings.
The decode into context approach grows at roughly 150,000 tokens per kilobyte of raw traffic, because every packet rides into context with its full framing. For the same reason, dumping the camera’s raw MQTT stream straight into a chat window would be just as expensive, publish message by publish message, image frame by image frame. At that rate, that “naive instinct” to load data directly into context runs out of room fast.
Our live run tests produced the numbers behind this table:
Loading the PCAP into an AI assistant cost 7.3x more and was wrong every time. Forget the cost difference for a second: an agent with a code sandbox successfully completes the job, and an agent staring at a wall of decoded packets doesn’t, no matter how much context you give it.
What This Means for the MPC Layer
Give the agent a code sandbox fed by search. Don’t dump a firehose of decoded packet text into the prompt. Canned carving tools like tshark and Zeek fail on adversary obfuscated channels because they have no carver for the protocol being abused. Prompt dumping fails for a different reason: reconstruction still needs the same decode logic, just done unreliably by a model reading JSON instead of a program executing code. A sandbox is the only one of the two that can run arbitrary decode logic, and it turns out to also be the cheapest, flattest scaling option.
A junior analyst using this MCP layer doesn’t just get a chatbot that summarizes a PCAP. They get an agent that reaches for a custom carve the moment the canned tools return zero files: the same reflex a ten-year SOC veteran has. The tokenomics work is what keeps that reflex affordable at real data sizes instead of quietly falling over past a few kilobytes.
Human in the Loop, and Auditability
None of this AI-driven analysis replaces the analyst. It augments the analysis process. It changes what the first hour of an analyst’s investigation looks like. The agent proposes. It carves the file, names the war room channel, drafts the finding. A person still decides whether it’s an incident, whether it gets escalated, and what stakeholders are needed to resolve the underlying risk to the organization.
A faster agent doesn’t shrink that boundary. If anything it raises the stakes on it; a wrong decision made in seconds is still a wrong decision. Every step the agent took is inspectable: which tool it called, what came back, what it concluded. A senior analyst can check a junior analyst’s agent-assisted finding as easily as they’d check a junior analyst’s own notes.
That auditability starts natively in Splunk Enterprise Security 8.x. Splunk’s MCP writes straight into Mission Control: every note the agent adds, every finding it links, every file it attaches becomes part of the investigation record the moment it happens: the same record a well-trained human analyst would leave working the case by hand. A reviewer doesn’t need to reconstruct what the agent did from a chat transcript - it’s already sitting in the case file, where the team already looks.
The same logic applies to the packet carving workflow, and the trial above already put a number on it: three runs of search plus sandbox recovered the images every time, three runs of decode into context recovered them zero times. That’s not a coincidence. Search plus sandbox never asked a model to look at the packets and describe what it saw. It asked the model to write and run code, so the result can be rerun and checked, not just trusted.
The Agentic SOC Stack, Working as One
Splunk answers what’s worth investigating and directs where to look. Endace answers what actually happened on the wire, the one layer that can’t be inferred, sampled, or reconstructed after the fact, unless you have the actual packets. Neither one closes the gap between a novice and a senior analyst on its own. MCP is what does: it lets an agent move between Mission Control and a packet capture the same way a ten-year veteran already does, without a human having to relay context between consoles. That’s the whole pitch for an agentic SOC that spans the stack instead of a single console. Each layer contributes what only it can prove, and the agent carries the investigation across all of them without losing fidelity or blowing the budget doing it.
Acknowledgements
Our thanks to the analysts, engineers, leaders, and executive sponsors who built the Agentic SOC, and to the humans who provided the decision-making expertise behind it. Their findings continue to protect conference networks from real cybersecurity risk, malware infections, and cybercrime.
Check out the other blogs by the humans in the .conf26 Agentic SOC.
Related Articles
From Static A&I to Continuous Entity Discovery Using Exposure Analytics in Splunk ES

Top 50 Cybersecurity Threats