Observability Blogs
Latest Articles
template
category
category
observability

10 Top Things to Monitor in Amazon RDS
Splunk Infrastructure Monitoring offers a dashboard out of the box that shows you the most important RDS metrics at a glance.

How We Monitor and Run Kafka at Scale
Learn from our experience with Kafka at scale: what to monitor and alert on, troubleshooting, and capacity planning. Splunk Infrastructure Monitoring offers a dashboard out of the box that shows you the most important Kafka metrics at a glance.
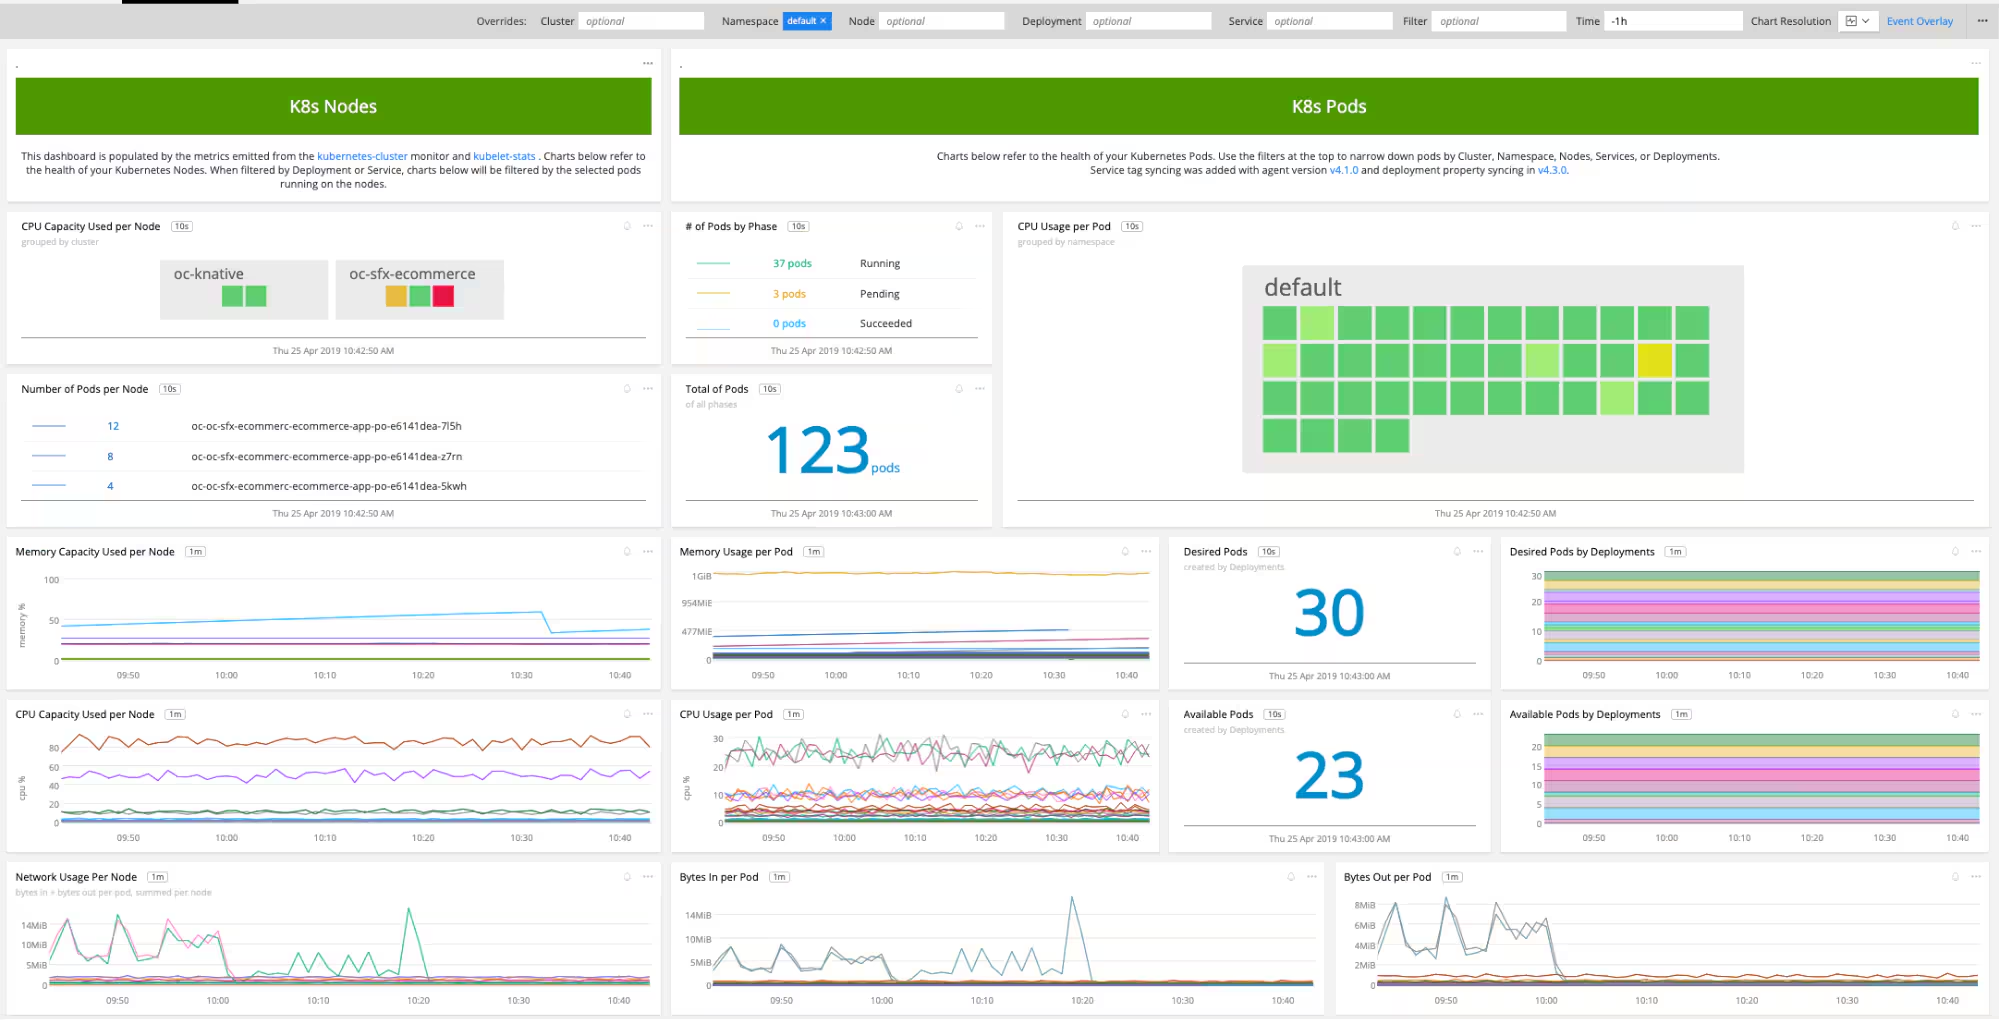
Monitoring Red Hat OpenShift with Splunk Infrastructure Monitoring
Red Hat OpenShift presents an increasingly popular option for developers and operations teams who want to easily build and deploy application containers on Kubernetes. What follows is a brief overview of Red Hat OpenShift, why Splunk Infrastructure Monitoring is particularly suited for monitoring OpenShift and Kubernetes environments...
Metrics from Prometheus Exporters Are Now Available with the Splunk Smart Agent
Get an overview of the integration between Splunk Infrastructure Monitoring and Prometheus, a few technical details, and tips on how you can get started immediately.
Splunk Ranked No. 1 in Gartner’s Market Share for Performance Analysis
Splunk is ranked No. 1 in Gartner’s Market Share: Enterprise Infrastructure Software, Worldwide, 2019 for Performance Analysis: AIOps, ITIM and Other Monitoring Tools category
![Getting Started with Citrix in Splunk - [Part 1]](https://www.splunk.com/en_us/blog/it/media_19eaeb6da259811ed55e1c4bf408fd05ddb103b37.webp?width=300&format=webp&optimize=medium)
Getting Started with Citrix in Splunk - [Part 1]
In this blog we are going to focus on getting Citrix-Data into Splunk - On-Prem/Private Cloud.

Understanding and Baselining Network Behaviour using Machine Learning - Part I
Learn about analytical techniques that help you to better understand your network and develop baseline for network behaviour and detect anomalies.
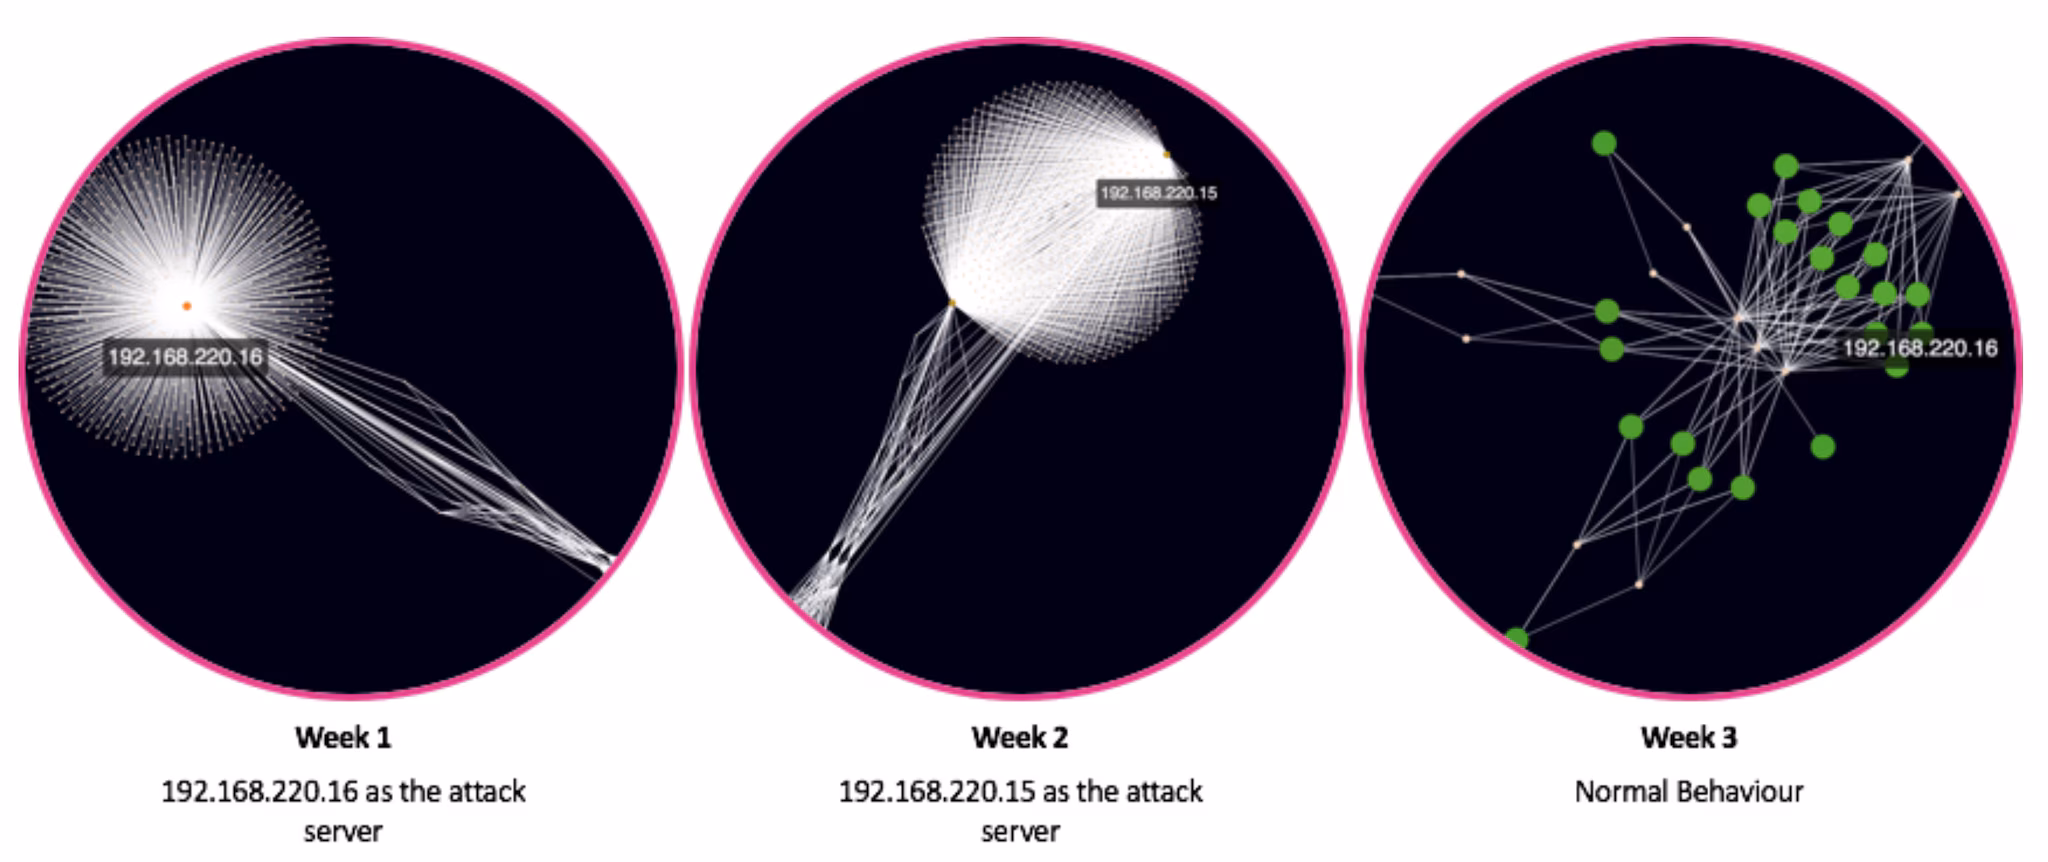
Understanding and Baselining Network Behaviour using Machine Learning - Part II
In this second installment we will continue to use the Coburg Intrusion Detection Data Sets (CIDDS) to determine baseline behaviour for one of the nodes we identified as critical in the first half of this series.
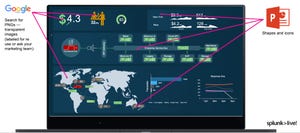
The Top 10 Glass Table Design Tips to Boost Your Career
Do not underestimate the power of great glass table design. Splunk EMEA Director of Product Marketing Stephane Estevez compiled 10 top tips on how you can step up your glass table game.