Observability Blogs
Latest Articles
template
category
category
observability
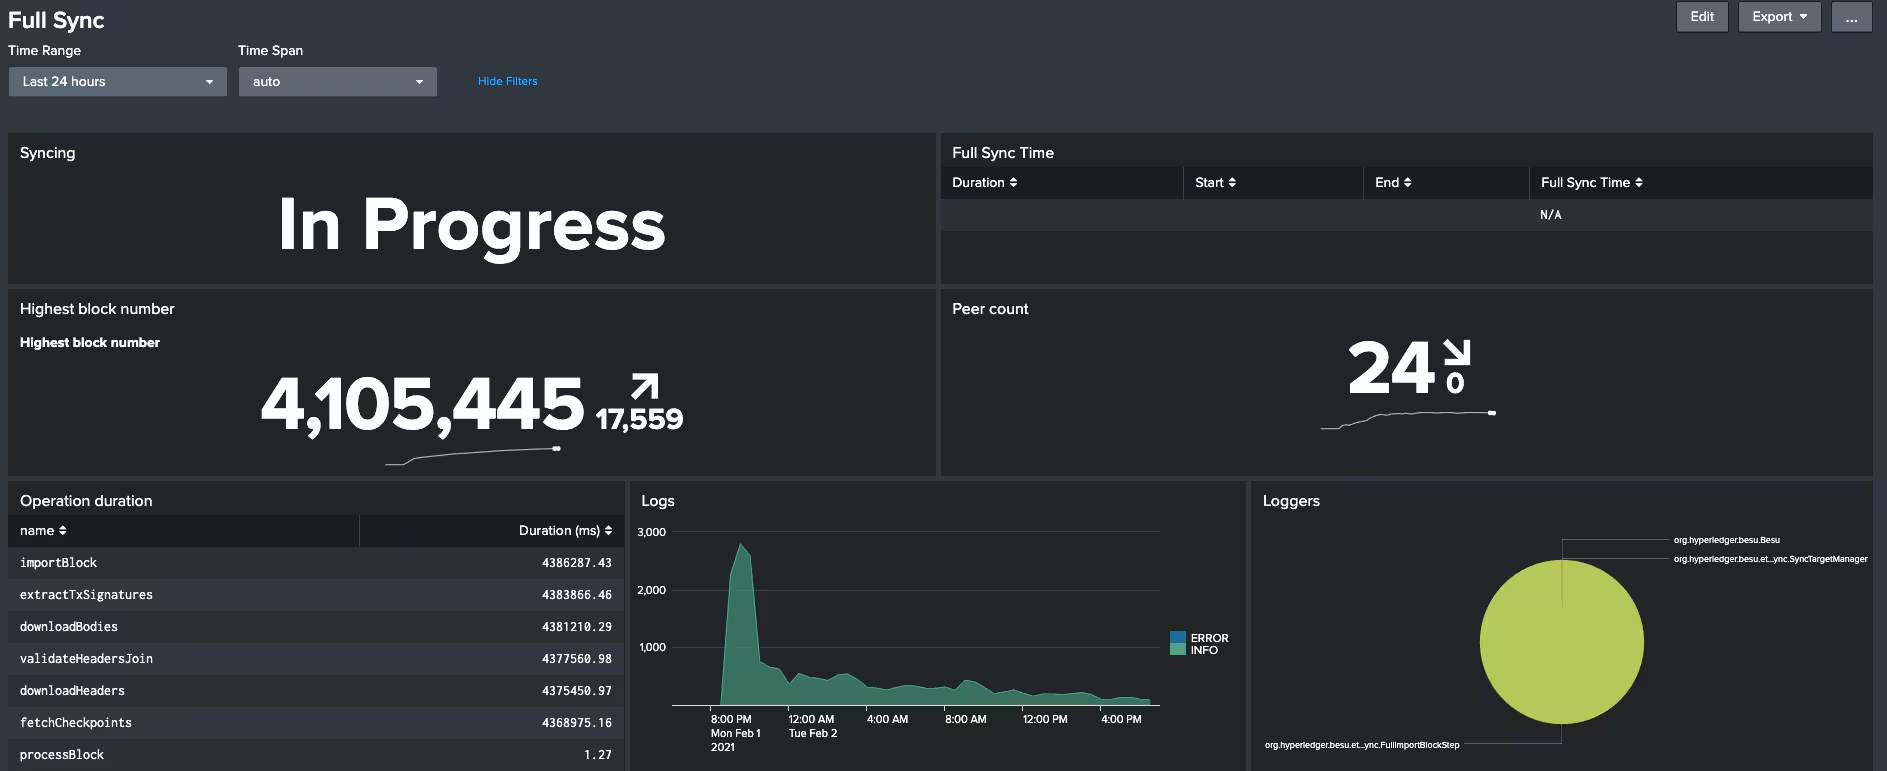
Hyperledger Besu is an Observability Pioneer
Hyperledger Besu is a Java-based, enterprise-ready, mainnet-compatible Ethereum client hosted by the Hyperledger Foundation, and now Hyperledger Besu integrates with the OpenTelemetry project to deliver real-time, actionable insights into your Ethereum client performance.

Introducing Splunk OpenTelemetry Java Lambda Wrapper
Introducing Splunk OpenTelemetry Java Lambda Wrapper. In this blog, we’ll show you how to deploy the wrapper with a Lambda layer for frictionless instrumentation
The OpenTelemetry Tracing Specification Reaches 1.0.0!
OpenTelemetry tracing specifications reached 1.0.0; which means tracing APIs and SDKs GA is imminent! Read more about this exciting announcement in this blog.

Getting the Most Out of Microsoft Exchange and Splunk ITSI
The Splunk IT Service Intelligence (ITSI) Content Pack for Microsoft Exchange provides a “quick start” out-of-the-box solution that delivers fast results and maximizes the value realized from ITSI. The content pack gives you depth and breadth of visibility across your Microsoft Exchange environments.

AWS Distro for OpenTelemetry — Now with Splunk Observability Support!
Today, we are excited to announce the release of the AWS Distro for OpenTelemetry with full Splunk Observability support! The AWS Distro for OpenTelemetry allows customers to capture metadata from AWS resources and managed services to correlate application performance data with underlying infrastructure data.

Observability with CI/CD in a Developer World
You need to monitor your apps and deploys equally. The Splunk Observability portfolio is the perfect complement to a CI/CD approach, from a developer laptop to an integration test environment.

A New Fast Lane to Value: Introducing Splunk’s IT Essentials Learn and Work Apps
Read all about our two new free new apps — IT Essentials Learn and IT Essentials Work — to help guide you on your journey towards IT maturity.

Prometheus Direct Integration Comes to Splunk Infrastructure Monitoring
A typical Prometheus environment consists of integrations that scrape your applications for four metric types; counters, gauges, summaries, and aggregated histograms. A central server is required to pull each of the endpoint resources and aggregate them.

Get The Most Out of Splunk Infrastructure Monitoring and Splunk ITSI
Curious about the new Splunk Infrastructure Monitoring Add-on both standalone and in the new Splunk Infrastructure Monitoring Content Pack for ITSI? It augments the documentation with real-world use examples and offers further descriptions of each element provided for free in the Content Pack.