The Next Step in your Metric Data Optimization Starts Now
Observability Martyna KarbownikIn the world of observability, managing metrics effectively is paramount. While our Metrics Usage Analytics (MUA) has empowered you to keep your data volume in check by identifying and optimizing unused metrics, the journey to a lean, cost-efficient, and insightful telemetry pipeline doesn't end there. We're excited to introduce the next evolution in smart telemetry management: Dimension Utilization, designed to tackle the often-hidden culprit of escalating costs and data bloat – high-cardinality dimensions.
The Silent Drain: When Dimensions Become a Burden
You've successfully dropped or archived unused metrics with Metric Pipeline Management but still find your telemetry bill higher than expected. The likely culprit? High-cardinality dimensions. These are dimensions that generate a vast number of unique values, leading to an explosion in Metric Time Series (MTS) count. Imagine a dimension like user_id in a system with millions of users, or request_timestamp that changes with every single event. While seemingly useful, such dimensions can:
- Skyrocket Costs: Combinations of dimension values creates a new MTS, directly correlating to increased storage and processing costs.
- Obscure Insights: A sea of high-cardinality data can make it harder to query, analyze, and extract meaningful insights, slowing down troubleshooting and decision-making.
- Strain Systems: Overly complex data models due to high cardinality can put a significant strain on your monitoring infrastructure, impacting performance and reliability.
Identifying these problematic dimensions, understanding their impact on specific metrics, and making informed optimization decisions in Pipeline Management isn’t always straightforward. Without clear visibility, it’s easy to overlook sources of inefficiency and unnecessary expense.
Unveiling Dimension Utilization: Your New Cardinality Compass
Dimension Utilization is a powerful new feature within Usage Analytics that provides unparalleled visibility and control over your dimensional data. It empowers you to pinpoint, analyze, and manage high-cardinality dimensions, transforming them from a cost liability into a strategic asset.
Key Features
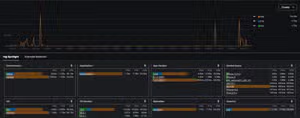
- Main Dimension View: A centralized dashboard displaying all dimensions, their numerical statistics (such as the number of unique dimensional values, the number of metrics with dimension, and the number of MTS with the dimension) and the information on whether and how they are used (e.g., in detectors, dashboard filters, or charts).

With this view you can easily:
- Identify unused dimensions - detect dimensions that no longer play an active role in your observability workflows.
- Identify dimensions with the highest number of unique values – these can potentially contribute the most to your metrics cardinality.
- Check whether a dimension is an essential component of many metrics, or if it occurs only by chance in a few.
- Take a quick glance at the detailed usage information by expanding Utilization columns, which will immediately show you how frequently a dimension is used across various components.
Dimension Profile Page: A dedicated view for each dimension, providing detailed information where exactly dimension is used (lists of associated metrics, dashboards, charts, detectors) and crucial sample values.

- Explore the dimension profile page to unlock comprehensive insights and empower your decision-making with data-driven confidence.
- Review components on which the dimension is used and evaluate whether they are critical for running your business. If the dimension is not frequently used, you may consider dropping it as well.
- From this view you can reduce your MTS cardinality creating aggregation rules for metrics in Metric Pipeline Management.
Note:
- Remember about the dropping the original metrics after creating the one with smaller number of dimensions
- Avoid empty charts and detectors when dropping data.
Both views are empowered by:
- Flexible Filtering & Sorting: Filter by time range (last 24 hours, 7 days, 30 days) and utilization rank. Sort tables by various columns to quickly find relevant data.
- Downloadable Reports: Export dimension information and detailed insights (metrics, dashboards, charts, detectors) in CSV format for offline analysis.
- Intuitive Visualizations: Single-value and trend charts display trends for hourly dimensional values, making it easy to spot anomalies.
- Consistent Definitions: Hourly MTS count, and Average Hourly MTS count are consistent with our existing Metrics Usage Analytics views.
Learn more: Analyze your dimensions with Usage Analytics
From Insight to Action: Optimize Your Dimensions with Confidence
Dimension Utilization turns deep visibility into measurable action. Here are a few practical ways it helps you make smarter, faster, and more cost-effective decisions.
1. Identify dimensions that contribute the most to you MTS Count:
Challenge: "As a user, I want to know which dimensions have the highest MTS count so that I can determine if they should be kept or dropped."
Solution: The main Dimension Utilization page provides a comprehensive view of all dimensions across your organization. To identify dimensions that contribute the most to your MTS count:
- Consider high values dimensions - vast number of unique values leads to an explosion in Metric Time Series (MTS),
- Look at the “MTS with dimension” column as well.
The table is sorted by default in descending order for "Average Hourly MTS count", bringing most impactful dimensions to your attention immediately.
2. Analyze Dimension Utility with Smart Ranking:
Challenge: “As a user, I need to understand if the dimension is used and how it’s being used, to be sure that it can be safely removed.”
Solution: We introduce a clear Utilization ranking system (R5 - R0) for each dimension:
- R5 Detectors: Referenced in detectors (highest utility).
- R4 Dashboard filters: Referenced in dashboard filters.
- R3 Active charts: Referenced in actively viewed charts.
- R2 API queries: Referenced in API queries or unsaved charts.
- R1 Inactive charts: Referenced in charts not actively viewed.
- R0 Unused: Not referenced at all (lowest utility).
This ranking, visible in the main table and drill-down views, provides an immediate understanding of a dimension's active use, guiding decisions on whether to keep, optimize, or drop it.
3. Evaluate Dimensions by Metric & Utility:
Challenge: “As a user, I want to know if a dimension exists in multiple metrics so that I can analyze its utility."
Solution: Our new Dimension Profile page (accessed by clicking on a dimension name) offers a deep dive. Here, you can see all the metrics a specific dimension is tied to, along with its utilization across various observability components. This helps you understand its true value and impact.
4. Troubleshooting dimension patterns:
Challenge:
“As a user, I would like to know how the number of dimension values changes over time, so that I can identify spikes contributing to unnecessary Metrics Time Series (MTS) bloat.”
Solution: By providing detailed insights like "Unique values”, "Percentage of total values," and "MTS with dimension”, you gain the necessary data to make informed decisions to reduce MTS bloat and manage costs. The trend charts display trends over time for hourly dimensional values, enabling quick detection of spikes and attribution to responsible parties.
5. Uncover Problematic Dimensional Values with Sample Data:
Challenge: "As a user, I want to know what kind of values a dimension has to get an idea on what the dimension is doing, and therefore understand its function, use and how valuable it is."
Solution: The Dimension Profile page includes a Sample Values tab, displaying up to 10 random dimensional values. This crucial insight helps you identify dimensions that might be generating unique values like timestamps, which often contribute to bloat without providing significant analytical value. It also helps highlight dimensions that might be sending the same value as another dimension, indicating potential redundancy.
Empowering Smarter Telemetry Management
Dimension Utilization is more than just a new feature; it's a strategic tool that empowers platform engineers and data managers to gain granular control over their observability data. By understanding the true impact and utility of each dimension, you can easily:
- Significantly Reduce Costs: By identifying and optimizing high-cardinality dimensions.
- Improve System Performance: By reducing data volume and complexity.
- Enhance Observability: By cutting through the noise and focusing on truly valuable data.
- Make Data-Driven Decisions: With clear insights into dimension usage and value.
Stop letting hidden cardinality bloat your telemetry! Embrace Dimension Utilization and unlock a new level of efficiency and insight in your observability practice. Take control of your data, optimize your costs, and ensure your metrics are always working for you.
If you’d like to dive deeper into how to use Dimension Utilization, check out our documentation:
If you want to refresh your knowledge of your metrics usage and cost management in Splunk Observability Cloud - or explore more practical ways to optimize your telemetry data - take a look at these related resources:
- Analyze your metric usage in Splunk Observability Cloud
- Keep Your Data Volume in Check With Metrics Usage Analytics
- From Chaos to Clarity: Managing Metrics at Scale in Splunk Observability Cloud
- Observability Costs: Tips for More Efficient Data Management.
..and selected sessions from .conf24 and .conf25:
- OBS1257 - Real-World Strategies for Optimizing Telemetry Costs: Insights from Industry Leaders
- OBS1462B - Mastering Growth Without Breaking the Bank: Your Guide to Scaling with Splunk® Observability Cloud
- OBS1522B - Scale Observability With Splunk® Observability Cloud Metrics Platform
For other recent Splunk Observability releases, check out the updates here.
Related Articles

Deep Dive into the App Start Experience

Increase Your Data Flexibility with Explicit Bucket Histograms in Splunk Observability Cloud
