Achieve Network Resilience with Splunk ITSI Content Pack for Cisco Data Center Networking
Observability Cale HiltsIn the modern enterprise, the network is no longer just "plumbing"—it’s the nervous system of digital resilience. When a service goes down, the first question is almost always: “Is it the network?”
For years, answering that question meant jumping between siloed dashboards, correlating manual traceroutes with application logs, and hoping the NOC and ITOps teams were looking at the same data.
Last year, we took a massive step toward solving this by launching the Splunk IT Service Intelligence (ITSI) Content Pack for Cisco Enterprise Networking. Aggregating Cisco Catalyst Center and Cisco Meraki data, it provides visibility into the health of your networks to bring campus and branch visibility directly into the Service Analyzer. Today, we are completing the trifecta.
We are thrilled to announce the Splunk ITSI Content Pack for Cisco Data Center Networking.
The Missing Link in Network Observability
While Catalyst and Meraki provide essential visibility into the "edge" and "user experience," the data center is where the heavy lifting happens. Whether you are running Cisco ACI or Nexus Dashboard, the data center network is the foundation for your most critical applications.
This new Content Pack allows ITOps practitioners to ingest telemetry from Cisco’s data center powerhouses and turn raw fabric data into Predictive AIOps insights. You can now monitor the health of your leaf-and-spine architecture with the same service-level context you use for your applications.
Why This Matters for the NOC and ITOps
For the practitioner on the front lines, this isn't just "more data"—it’s better context.
-
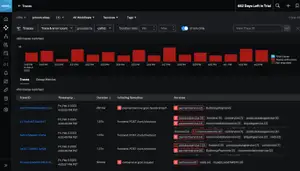
Reduced Alert Noise: For NOC teams, the "Alert Storm" is the enemy. This content pack includes pre-configured Aggregation Policies that group related network events into high-level "Episodes," allowing your team to focus on the root cause rather than the symptoms.
center 
-
Unified Service Health: No more guessing if a database lag is caused by a congested Nexus switch or a noisy neighbor in the fabric. By combining Data Center, Catalyst, and Meraki data, ITSI provides a "Single Pane of Truth" for the entire network path.
center 
-
Predictive Foresight: Leveraging ITSI’s predictive analytics, the content pack identifies trends in fabric utilization and buffer health before they result in packet loss or application degradation.
center 
Figure 2 showing the Entity Overview Dashboard for a Nexus Fabric
- Out-of-the-Box Glass Tables: We’ve included executive-ready Glass Tables that visualize the health of your global network—from the remote branch (Meraki) to the corporate campus (Catalyst) and into the core (Data Center).
Building a Resilient Digital Enterprise
With the addition of Data Center Networking, Cisco and Splunk are delivering on the promise of Unified Observability. By breaking down the walls between NetOps and ITOps, we are giving teams the visibility and foresight required to power a resilient digital enterprise.
If you are already using our Catalyst and Meraki content packs, adding the Data Center pack is the logical next step to eliminate your remaining blind spots.
Ready to see the full picture? Download the Splunk ITSI Content Pack for Cisco Data Center Networking in Splunkbase today and start transforming your network data into digital resilience.
Related Articles

Ahead of the Curve: How Recent M&A Forecasts New Observability Trends for 2026

How to Use Observability to Reduce MTTR
