Beyond the Metric Name: Solving the Discovery Challenge in Observability
Observability Courtney GannonKey takeaways
- Metrics Explorer helps teams find the right monitoring data faster by searching based on services, teams, or workloads instead of confusing metric names.
- It brings metrics, sources, and context into one place, reducing guesswork and helping teams spot gaps in monitoring coverage.
- By making it easier to build charts and alerts, Metrics Explorer helps engineers solve issues faster and improve system reliability.
In the world of observability, data is everywhere. But as any engineer or SRE knows, having access to data and actually finding the right data are two very different things.
For many enterprise organizations, the process of creating a simple chart or detector has become a bottleneck. Whether you are a central monitoring team member trying to build dashboards for a service you didn't develop, or a developer trying to track a new KPI, the experience is often hindered by a common set of obstacles.
The Hidden Costs of "Tribal Knowledge"
The primary issue isn't a lack of data—it’s the difficulty of navigating it. We see three recurring problems that slow down development velocity and impact Mean Time to Resolution (MTTx).
- Inconsistent Naming Standards: As organizations scale, different teams adopt different naming conventions. Trying to find a "CPU usage" metric when it’s named cpu_utilization in one service and system_load_pct in another is an error-prone, time-consuming process.
- The "Tribal Knowledge" Gap: When monitoring teams are disconnected from the development lifecycle, they lack the context of what has been implemented. Over time, as stakeholders change and assets evolve, the knowledge of what data is being collected—and what it actually represents—is lost.
- Fragmented Discovery Tools: Users are often forced to jump between multiple services to find metrics and metadata, leading to a disjointed experience that makes it impossible to verify if the data provides the coverage needed for critical entities.
When users can’t identify the right data, they can’t build the right detectors. This leads to gaps in monitoring coverage, which often only become apparent after a customer-impacting incident occurs.
A New Approach: Entity-Centric Discovery
The solution is to stop searching for metric names and start searching for the entities that matter.
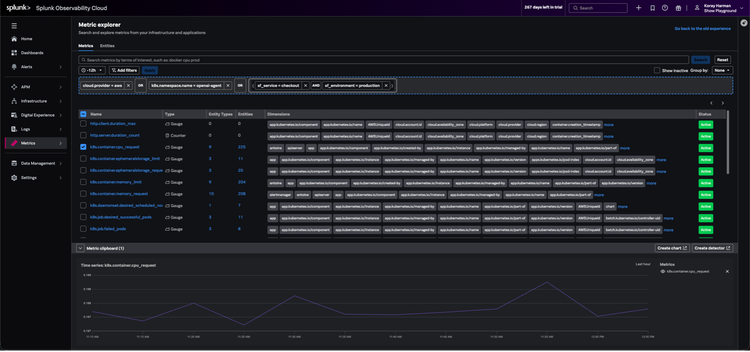
Metrics Explorer is designed to shift the mental model from "What is this metric called?" to "What entity am I trying to monitor?" By leveraging the power of an Entity Platform, this new workflow allows users to:
- Scope by Context: Use metadata—like business units, workloads, or development teams—to isolate the entities you care about.
- Gain Immediate Clarity: View associated metrics, cardinality counts, and source domains (AWS, OTEL, Azure, etc.) in one unified interface.
- Ensure Full Coverage: Quickly identify gaps in your monitoring strategy. If a service is missing a specific KPI, you’ll know immediately, allowing you to integrate the right data before a production issue arises.
- Accelerate Time-to-Insight: Once you’ve identified your metrics, the transition from discovery to creating a chart or detector is seamless. You can filter, group, and visualize data in a timeline view before committing to a final dashboard.
Empowering Your Team
Metrics Explorer isn't just a search tool; it’s a bridge. It enables central monitoring teams to support new services without needing to be subject matter experts on every internal project. It empowers developers to quickly find the KPIs they need to track their own success.
By centralizing discovery and focusing on the entities that drive your business, you can move away from the frustrating, manual search for data and toward a more confident, comprehensive, and scalable approach to observability.
Ready to simplify your discovery process? Explore the new interface today and see how easy it is to turn raw data into actionable insights. Check out our docs here.
Related Articles

Splunk Security Content for Threat Detection & Response: August 2026 Update

Addressing CISOs AI Anxieties Through Resilience