Rethinking Kubernetes Monitoring in Splunk Observability: A More Intuitive, Holistic Experience
Observability Hemant SethKubernetes has become the backbone of modern application infrastructure, providing flexibility and scalability for teams of all sizes. Yet, as many organizations have discovered, monitoring Kubernetes environments poses a unique set of challenges—ones that traditional monitoring tools often struggle to address.
The Complexities of Monitoring Kubernetes Today
Monitoring Kubernetes isn’t just about tracking CPU usage or memory consumption. Operators and developers face a range of hurdles, such as:
- Complex, Dynamic Environments: With workloads continuously changing, keeping track of what’s running—and why—can be difficult.
- Limited Visibility into Desired State: Unlike traditional systems, Kubernetes is driven by a desired state model. Understanding not just what is happening, but what should be happening, is critical.
- Fragmented Data Sources: Relevant information is often scattered across metrics, logs, events, and configuration files, making it hard to assemble a complete picture.
- Navigation and Usability: Large clusters and numerous resources can make it tough to quickly locate and interpret the data you need for troubleshooting or optimization.
What Does a Good Kubernetes Monitoring Experience Look Like?
An effective Kubernetes monitoring solution should do more than simply collect and display data. It should:
- Empower Actionable Insights: Guiding users toward solutions, not just presenting raw information.
- Surface Both Current and Desired State: Allowing users to spot discrepancies and configuration drift before they cause issues.
- Bring Data Together: Correlating metrics, logs, events, and configurations in a unified experience for faster root cause analysis.
- Leverage AI-Driven Insights: Harnessing AI and machine learning to automatically analyze patterns, detect anomalies, and accelerate root cause analysis, so users can resolve issues before they impact workloads.
- Offer Intuitive Navigation and Context: Making it easy to find, filter, and understand resource states without getting lost.
Our Journey: Listening, Learning, and Innovating
As we continue to evolve Splunk Observability K8s monitoring offering, we’re always looking for new ways to deliver even more value to our users. We identified opportunities to further enhance the user experience. For example:
- Navigation and Usability: We’re refining our navigation to make it even more seamless, helping users move between resources and views with greater ease.
- Broader Data Perspectives: Building on our solid foundation of time series metrics, we’re expanding to include additional context—such as the desired state defined in YAML manifests—to provide a more comprehensive view.
- Greater Interactivity and Exploration: We’re introducing more flexible and interactive views, moving beyond traditional dashboards and charts to enable deeper, more intuitive exploration of your Kubernetes environment.
How We're Addressing These Challenges
Our recent improvements in the November release are directly addressing these challenges with the following enhancements:
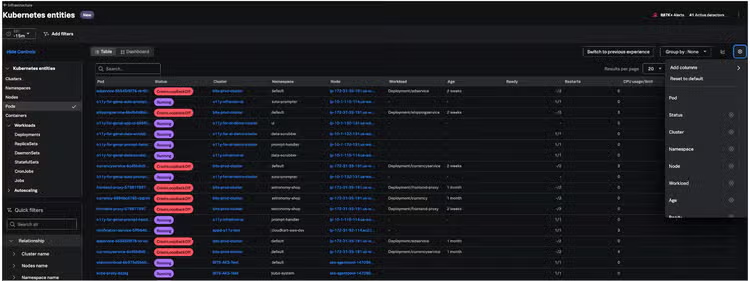
- Flexible Table Views and In-Context Navigation: Introducing customizable tables as the primary interface, complemented by flyouts that reveal rich, contextual information about each object—right where you need it, without losing your context.
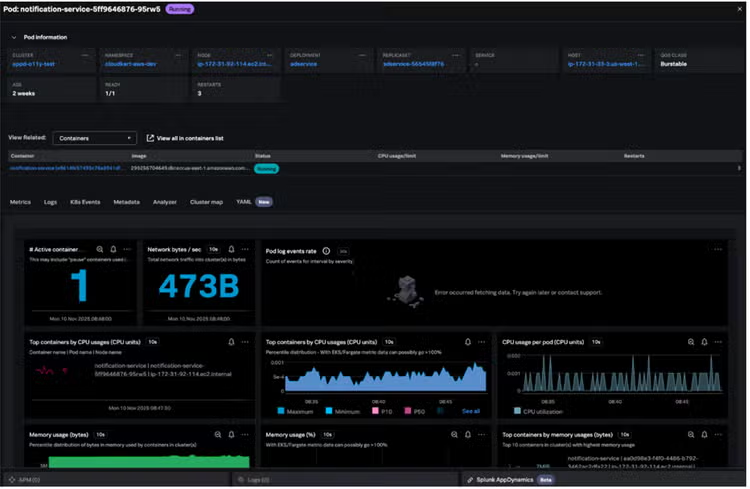
- Holistic, Correlated Data in the newly designed instance views: By bringing together metrics, logs, events, and configurations in a unified view, our new approach simplifies connecting the dots and helps you resolve issues faster.
-
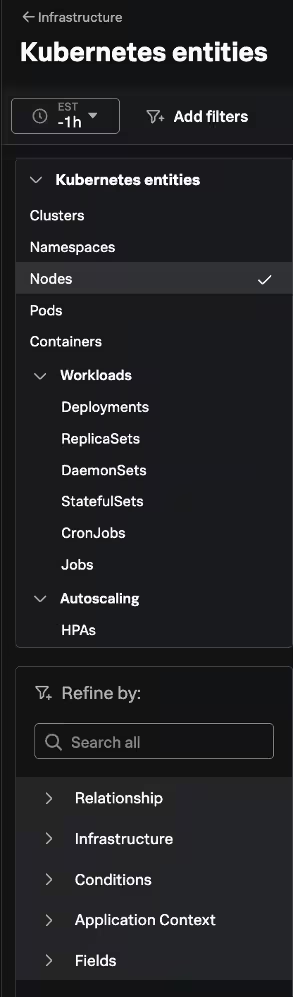
Enhanced Filters and Search: Our redesigned faceted filters and structured information architecture make it simple to identify frequently used filters and zoom in on the resources or events that matter most
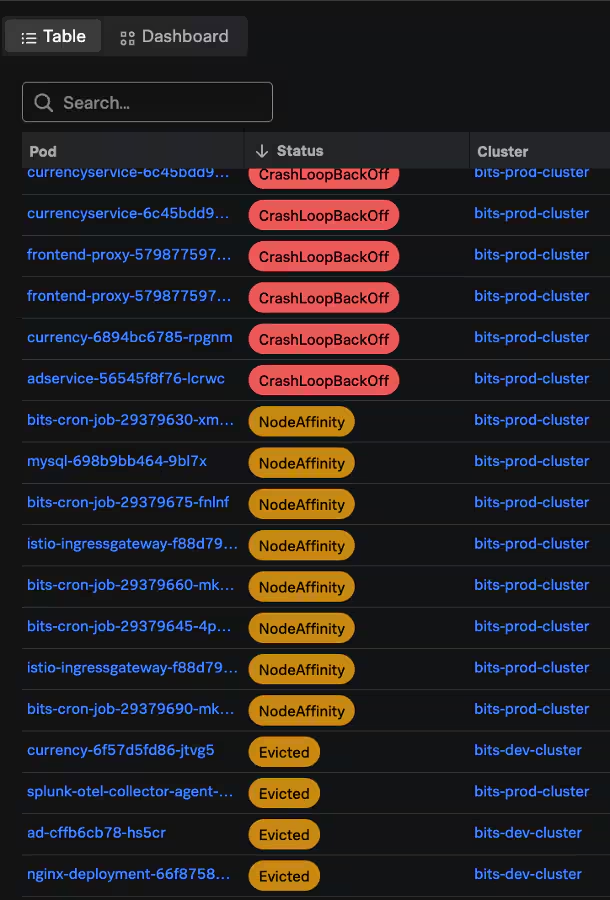
- Improved Problem Isolation: By collecting detailed node conditions as well as pod reason codes and phases, delivers real-time visibility into incidents such as nodes under pressure, pods in CrashLoopBackOff, Image pull failures, and more. This enhanced insight allows users to quickly detect, isolate, and respond to issues as they arise—helping to minimize downtime and maintain optimal performance across your Kubernetes clusters.
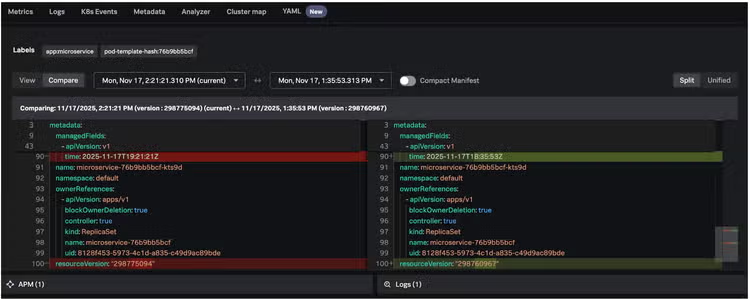
- Desired State Awareness: By collecting and analyzing YAML manifests alongside metrics, logs, and events, the platform now provides direct visibility into both the current and desired state. This helps users quickly spot where things have drifted from the intended configuration, enabling proactive monitoring.
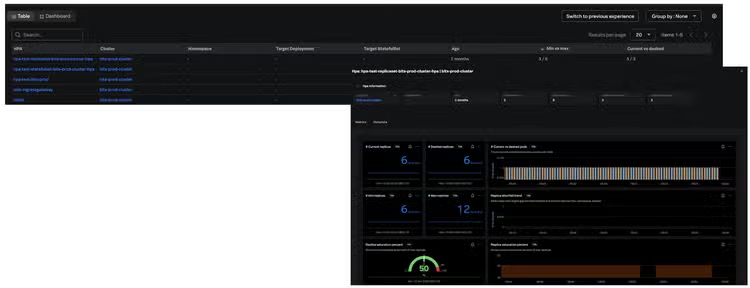
- Expanded Data Support – HPA Autoscaling Visibility: Support for monitoring Horizontal Pod Autoscalers (HPA), giving users clear visibility into how your workloads are being automatically scaled based on real-time metrics. With insights into HPA status, scaling events, and thresholds, you can better understand and optimize your cluster’s resource allocation, ensuring applications scale efficiently and reliably to meet changing demand.
Why This Matters for Your Team
By focusing on these improvements, we aim to reduce the guesswork and manual effort required to keep your Kubernetes environments healthy. With clearer visibility into both what’s happening and what’s supposed to happen, your team can:
- Detect and resolve issues faster
- Prevent unintended configuration changes
- Operate with greater confidence at scale
We believe that great Kubernetes monitoring should feel less like searching for a needle in a haystack and more like having a well-organized dashboard in a modern cockpit—where the right information is always at your fingertips, and you’re always aware of both your destination and your current heading.
We’re excited for you to experience these updates and to hear your thoughts as we continue to evolve together. For more details refer to release notes.
Related Articles

Why Public Sector Downtime Is a Service Delivery Problem

Splunk Security Content for Threat Detection & Response: March Recap