On-prem application performance monitoring is still relevant, here’s why
Application users want seamless digital experiences — and they want them now. This common thread has organizations grappling with how to meet user expectations in increasingly complex application environments. Despite the cost and scalability benefits of cloud native applications, research shows more than half of organizations (54%) are moving workloads and data away from public clouds. Why? Reasons are unique, but many agree that the cloud can’t compete with an in-house solution when it comes to keeping data private, secure and compliant.
With a recent survey showing 94% of organizations still using on-prem servers in some way, it’s easy to see that hosting applications onsite remains relevant for delivering the high-performing digital experiences users want while sustaining a focus on security. While many organizations prefer the ease and efficiency of cloud-based applications — delivering optimal performance doesn’t require public cloud infrastructure. With the right application performance monitoring solution, technologists can optimize fluctuating workloads and support the dynamic scale-out/back strategy they need — regardless of infrastructure type.
Optimizing on-premises applications
For many organizations, the most difficult part of on-prem optimization is maintaining a clear picture of user behavior during peak demand and keeping up with the planning and support required to meet such demand. However, the ability to do so is critical in today’s digital environment, where user experience and user trust are key drivers of application KPIs. Planning, supporting and managing demand requires technology and business leaders to stay apprised of the data center inventory, resource usage and peak times to ensure quick responses to rapid fluctuation. Common techniques include load balancing, managing bandwidth, compression, caching and deduplication — plus monitoring network and storage performance and utilization. Doing so enables teams to adjust settings and allocate accordingly to distribute workloads, reduce latency, save space and optimize availability.
Support an Agile and DevOps Culture
Collaboration is at the root of Agile and DevOps methodologies, and both can help optimize in-house application environments by enabling proactive, faster, more frequent and more collaborative development, iterations and delivery. Therefore, adopting a common tooling framework includes support for version control and CI/CD, plus continuous testing, monitoring and improvement that helps align digital experiences with business goals.
Leverage the right application monitoring tool for on-premises environments
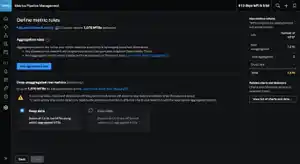
Application performance monitoring (APM) is a methodology that allows technologists to see application health status in a shared view and detect the source of issues. It that way, it can eliminate roadblocks between siloed teams and support fast and proactive remediation of user experience problems. Leveraging APM best practices in a shared view can also ensure a strong portfolio, which is key to preventing risk associated with outdated technology, poor documentation and/or lack of ownership that may plague legacy, on-prem environments. And not to be overlooked — cultivating an APM practice provides a platform from which IT and business stakeholders can quickly and easily understand exactly how app performance impacts revenue-generating transactions.
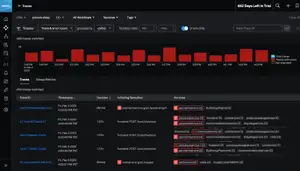
User journeys: Monitoring on-premises user journeys with business context
When a business-critical transaction, such as shopping cart checkout or loan application submission suffers, IT and business leaders need to prioritize and fix issues — fast. Having an always-on, proactive view of application health across on-prem hosted user transactions is key. With journey mapping, an organization can measure how business components and customer experience come together to drive top-level KPIs. For example, optimizing new bank account setup or loan submission processes or online retailers getting a complete view of how customers shop online. With it, technologists and business stakeholders can see issues across all the different parts of user journeys that impact application health and business outcomes.
Business journeys: Monitoring on-premises performance across multiple events
Business Journey Mapping gives modern businesses insights to improve the building and running of mission-critical and strategic services. It works with application performance monitoring and enables app teams to author, join, analyze and monitor multiple distributed business events as a single process. With it, teams can identify patterns and discover performance latency, risk and opportunity for an entire line of business.
Let’s take the loan application workflow as an example. Application submission information may come from business transaction events, but document verification and loan application status might come from logs. And credit approval and underwriting are often tied to third-party service provider actions while final approval could be updated in transaction events. Mapping the entire journey to ensure a smooth transaction for the borrower and the loan officer supports a high-performing user experience for both — and enables IT to validate investments and prioritize coding fixes and feature releases based on what matters most.
For more information about how Cisco AppDynamics can help your organization optimize on-premises application performance, read what Ronak Desai, Cisco SVP & GM AppDynamics and full-stack observability has to say about On-premises to cloud: Observability for customers where they are and where they’re going.
Related Articles

The State of Observability 2023: Realizing ROI and Increasing Digital Resilience
It Takes a Village – And Some New Features From Splunk – To Scale Your Cloud Monitoring Without Breaking the Bank

How I fell in love… with Data Governance (no, really)
New APM Capabilities Help Optimize Application Performance Across Monoliths or Microservices

Splunk Synthetics in Observability Terraform Provider Released

New Splunk Observability Innovations Deliver Accelerated Troubleshooting for Engineering Teams

Getting Started with Observability: What is OpenTelemetry?

Cisco introduces full-stack observability enhancement: Business Risk Observability