Introducing Log Observer Connect for AppDynamics
Observability Dave HickmanLog Observer Connect for AppDynamics enables in-context navigation between AppDynamics and Splunk. This unified observability troubleshooting experience promises to streamline problem identification, but also aligns cross-functional teams by providing shared insights into application performance issues across tools.
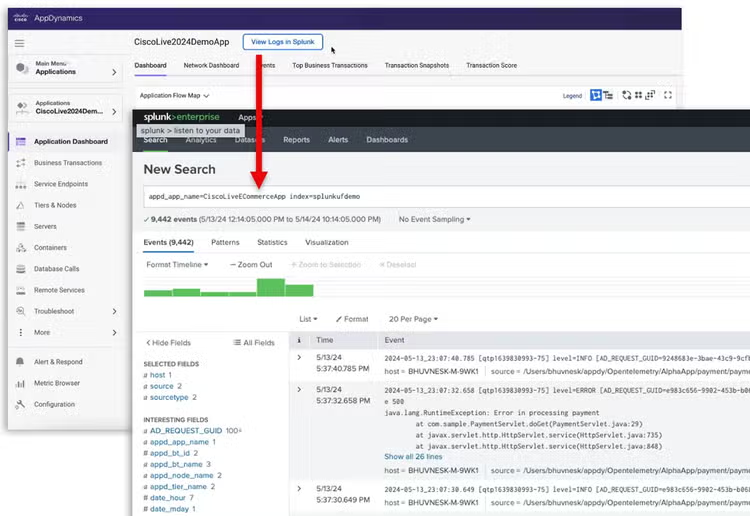
Log Observer Connect for AppDynamics is a new log integration with Splunk that lets observability users centralize log collection in Splunk and analyze them in context with Cisco AppDynamics hybrid application observability for frictionless troubleshooting and faster root cause analysis while reducing operational costs. This new integration adds new log analysis use cases for Cisco Full-Stack Observability.
It’s no secret that most organizations use multiple monitoring and observability tools to understand and troubleshoot application performance. But the lack of integration between tools results in “swivel-chair troubleshooting,” forcing observability users (i.e., SRE, Developers, and IT Operations) to switch back and forth between disparate tools, continually and having to stop and restart the troubleshooting workflow in each transition.
AppDynamics + Splunk
We’ve moved quickly to integrate Splunk into the Cisco Full-Stack Observability solution architecture in just a few short months since the acquisition. Through our Unified Observability Experience initiative, we are integrating AppDynamics and Splunk Enterprise/Cloud with a unified experience, shared resources, and shared use cases. The result is to simplify the troubleshooting workflow, reduce the time to identify root cause, and speed up mean-time-to-resolution (MTTR).
Centralize logs in Splunk and optimize costs
Many teams use logs for troubleshooting, so storing all your logs in a central repository with shared access makes sense. Plus, centralizing logs in Splunk eliminates the costs of ingesting the same logs into multiple repositories. With the Splunk Universal forwarder and technical add-ons (TAs), you can easily forward your application logs from AppDynamics into Splunk Enterprise/Cloud.
Analyze logs in context with deep links
Log Observer Connect for AppDynamics uses deep linking from apps, tiers, nodes, business transactions, and transaction snapshots in AppDynamics to the related logs in Splunk Enterprise/Cloud. Along with single sign-on, deep linking streamlines your troubleshooting workflow for an uninterrupted user experience, which optimizes the troubleshooting process. The combination of AppDynamics and Splunk speeds root cause analysis for faster identification and problem resolution. When used together, AppDynamics uses metrics, events, and snapshots to tell you “what, when, and where” problems are occurring, while Splunk logs help you understand “why.”
Point-and-click log analytics
Splunk provides world-class log analytics with an intuitive no-code interface, out-of-the-box dashboards, and pre-packaged filters for faster troubleshooting and root-cause analysis. When utilizing the deep links within the AppDynamics user interface, valuable application metadata, including the same timeframe, is automatically passed to Splunk to ensure a seamless transition. Together, in-context log analysis will allow you to resolve most application-related performance issues quickly.
Share data across teams with bi-directional integration.
Soon, Log Observer Connect for AppDynamics will allow users to view multiple telemetry types in a single interface and provide even greater context before employing the deep links between products. We’re working on the ability to preview logs in AppDynamics to gain contextual insight to streamline the troubleshooting workflow. At the same time, Splunk users will be able to preview metrics, events, and snapshots within Splunk to determine the business impact of log-related issues that surface within Splunk. Shared context will help to align teams around common priorities to minimize any impact on the business.
Learn more:
Visit our Log Observer Connect for AppDynamics web page.
Take an interactive tour
Watch the replay for the Better Together: Introducing new Splunk integrations and AI innovations for Cisco AppDynamics webinar, where you will learn about new observability and operational efficiency enhancements—from AI innovations to Splunk log analysis solutions for AppDynamics.
In his latest blog, “Bringing the Cisco AppDynamics + Splunk Better Together story to Cisco Live,” Ronak Desai, SVP, GM Cisco AppDynamics and Full-Stack Observability, shares his thoughts on Cisco Live and the AppDynamics + Splunk – Better Together story.
Lastly, these blogs provide additional insights into these recent announcements:
Related Articles

DORA, Operational Resilience and Intelligent Observability
![Getting Started with Citrix in Splunk - [Part 1]](https://www.splunk.com/content/dam/splunk-blogs/images/media_19eaeb6da259811ed55e1c4bf408fd05ddb103b37/getting-started-with-citrix-in-splunk-part-1.webp?width=300&format=webp&optimize=medium)
Getting Started with Citrix in Splunk - [Part 1]
