Cisco AppDynamics: A Gartner® Customers’ Choice Vendor
At Cisco, customers are the heartbeat of our business — their feedback is incredibly important, and it’s why we do what we do. That is why I was excited to read the December 2023 Gartner® “Voice of the Customer for Application Performance Monitoring and Observability*,” where Cisco is recognized as a “Customers’ Choice” vendor for APM and Observability on Gartner® Peer Insights™.
The report is based on nearly 2,000 reviews submitted by customers during an 18-month period between August 2022 and October 2023 and provides an aggregated perspective into customers’ experience implementing and operating their chosen observability offerings1. The “Customers’ Choice” recognition is only given to those vendors who meet or exceed both the market-average overall experience and market-average user interest and adoption.
In addition to being named one of the overall Customers’ Choice vendors, the report exemplifies our ongoing commitment to serve our customers by addressing their current and future needs.
-
- In 2023, we were recognized as a Customers’ Choice vendor in six of the eight segment views.
- Our customer’s “Willingness to Recommend” score is 93% in 2023.

We have been actively listening to our customers not only to fuel the next generation of innovation but also to radically advance the state of the observability market. We’re pleased that 2023 showed that our vision for and execution toward full-stack observability is resonating with customers in many segments. We dramatically accelerated our pace of innovation by more than doubling our new features released to the market year-over-year in 2023, including Cisco Observability Platform, Cisco Cloud Observability, Smart Agent for AppDynamics SaaS, a market-leading Digital Experience Monitoring solution with our Cisco ThousandEyes integration, Cisco Secure Application for hybrid and cloud-native workloads, increased feature velocity on Cisco AppDynamics on-premises and many more. In all, we introduced over 600 new capabilities in 2023, and our customers are taking notice. Tired of bespoke tools and monitoring practices that have created tool sprawl, unnecessary spend, and sub-par experiences for their users, customers are partnering with Cisco to build new observability centers of excellence to advance their observability journey from siloed and reactive to proactive and predictive.
Delighting customers will always be our priority, and we recognize there is always work that can be done as our customer needs evolve. Interested in reading the full Gartner report? You can read it here.
*Gartner Voice of the Customer for Application Performance Monitoring and Observability, Gartner, Inc., by Peer Contributors, December 29, 2023
Gartner Peer Insights TM content consists of the opinions of individual end users based on their own experiences with the vendors listed on the platform, should not be construed as statements of fact, nor do they represent the views of Gartner or its affiliates. Gartner does not endorse any vendor, product or service depicted in this content nor makes any warranties, expressed or implied, with respect to this content, about its accuracy or completeness, including any warranties of merchantability or fitness for a particular purpose.
GARTNER is a registered trademark and service mark of Gartner, Inc. and/or its affiliates in the U.S. and internationally and is used herein with permission. All rights reserved.
This graphic was published by Gartner, Inc. as part of a larger research document and should be evaluated in the context of the entire document. The Gartner document is available upon request from Cisco AppDynamics.
1 Gartner, Gartner Peer Insights TM Voice of the Customer for Performance Monitoring and Observability
Related Articles

Display a Persistent Banner Message with the New Global Banner

A Pattern for Optimizing Go
Extracting Data from Splunk Infrastructure Monitoring

Having Cake and Eating It: How to Use Terraform to Build Splunk Alerts From Code

Monitor Containerized Deployments on AWS Bottlerocket with Splunk
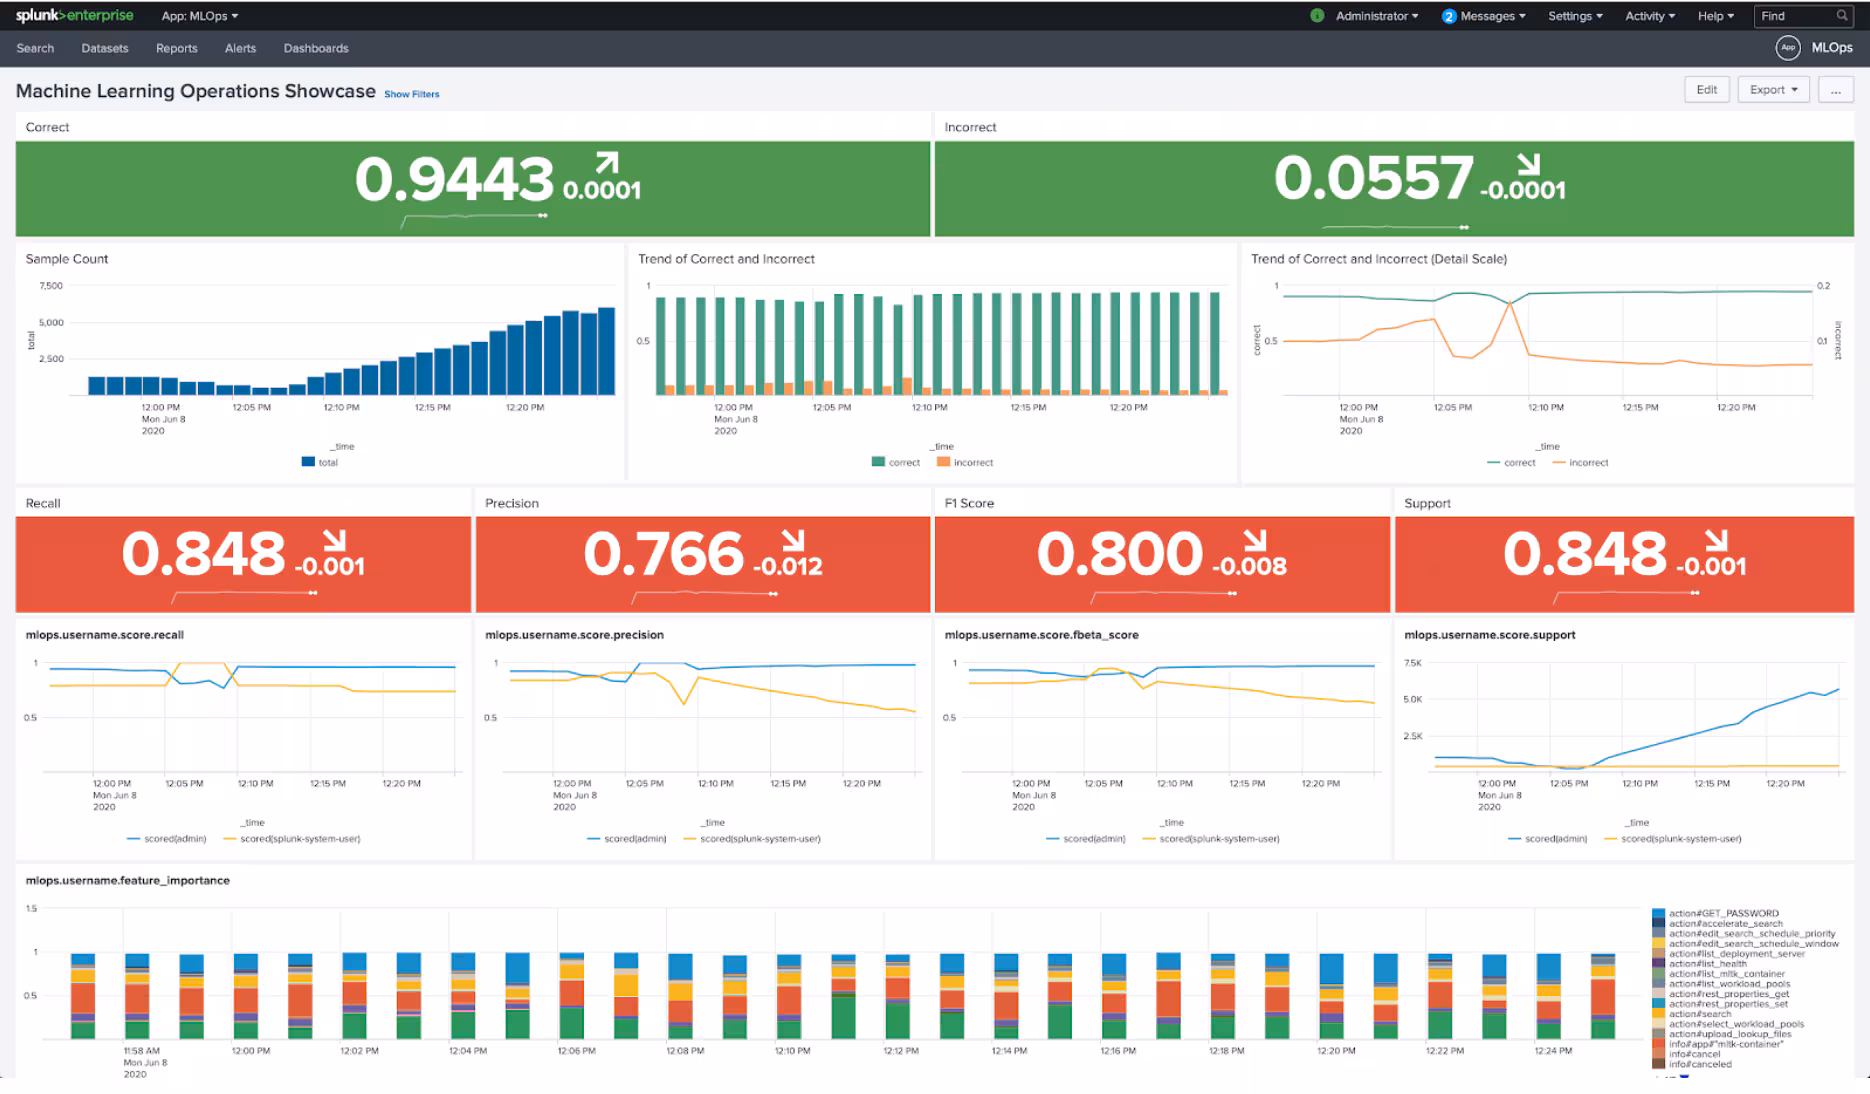
MLOps - Logs, Metrics and Traces to improve your Machine Learning Systems
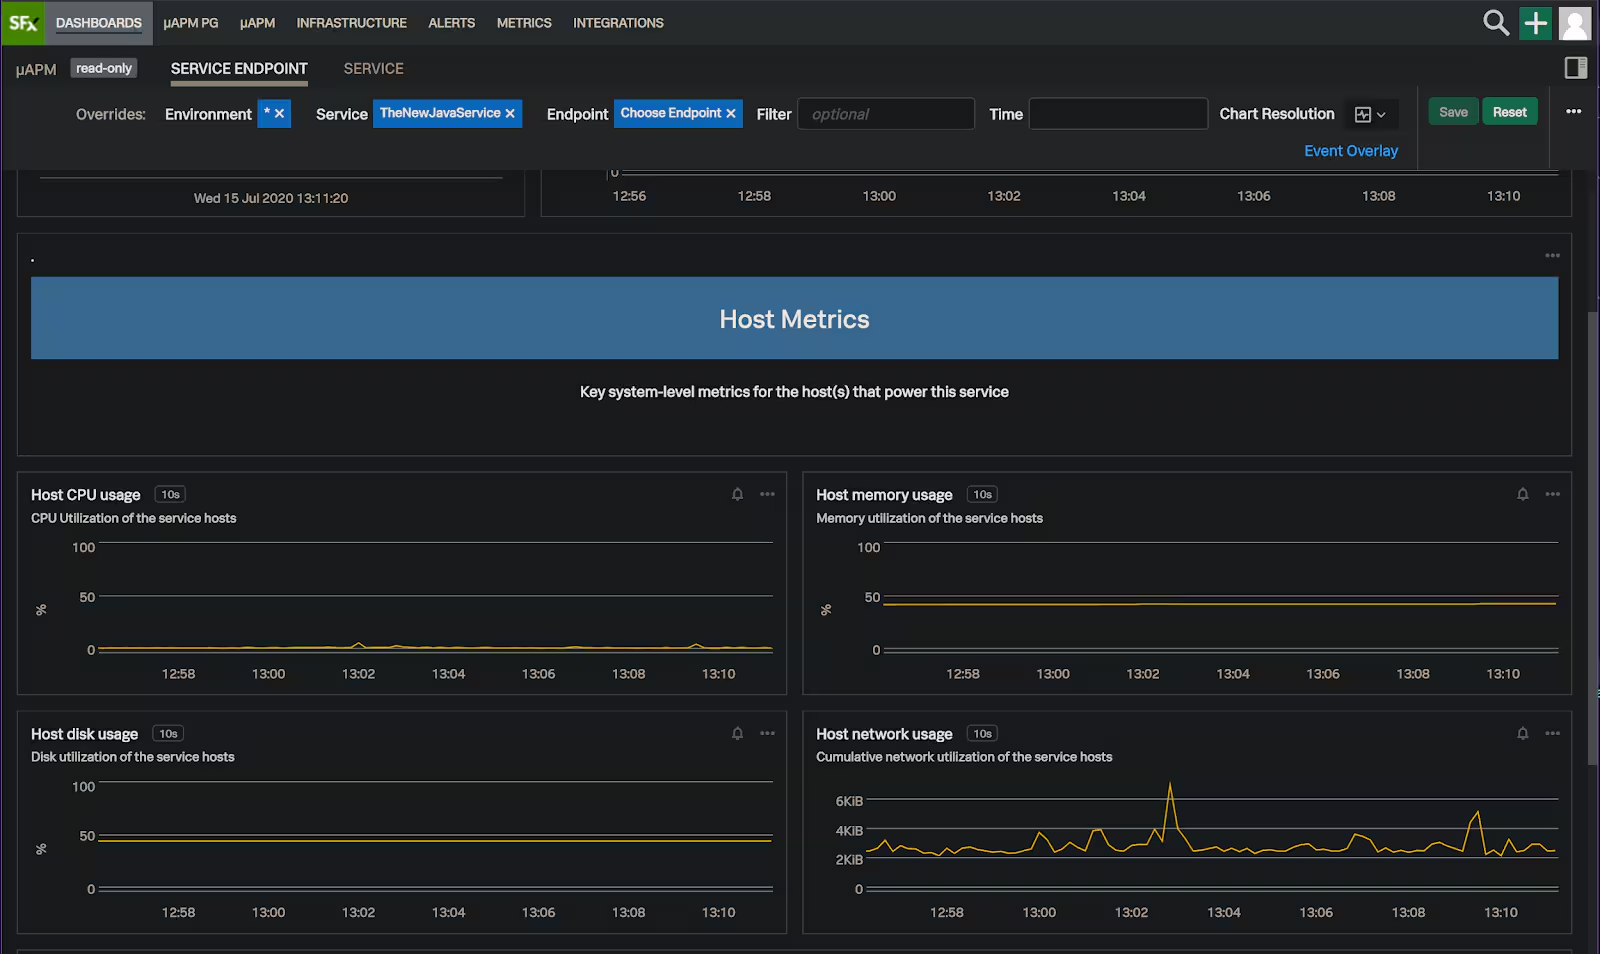
Full Java Observability in 5 Simple Steps
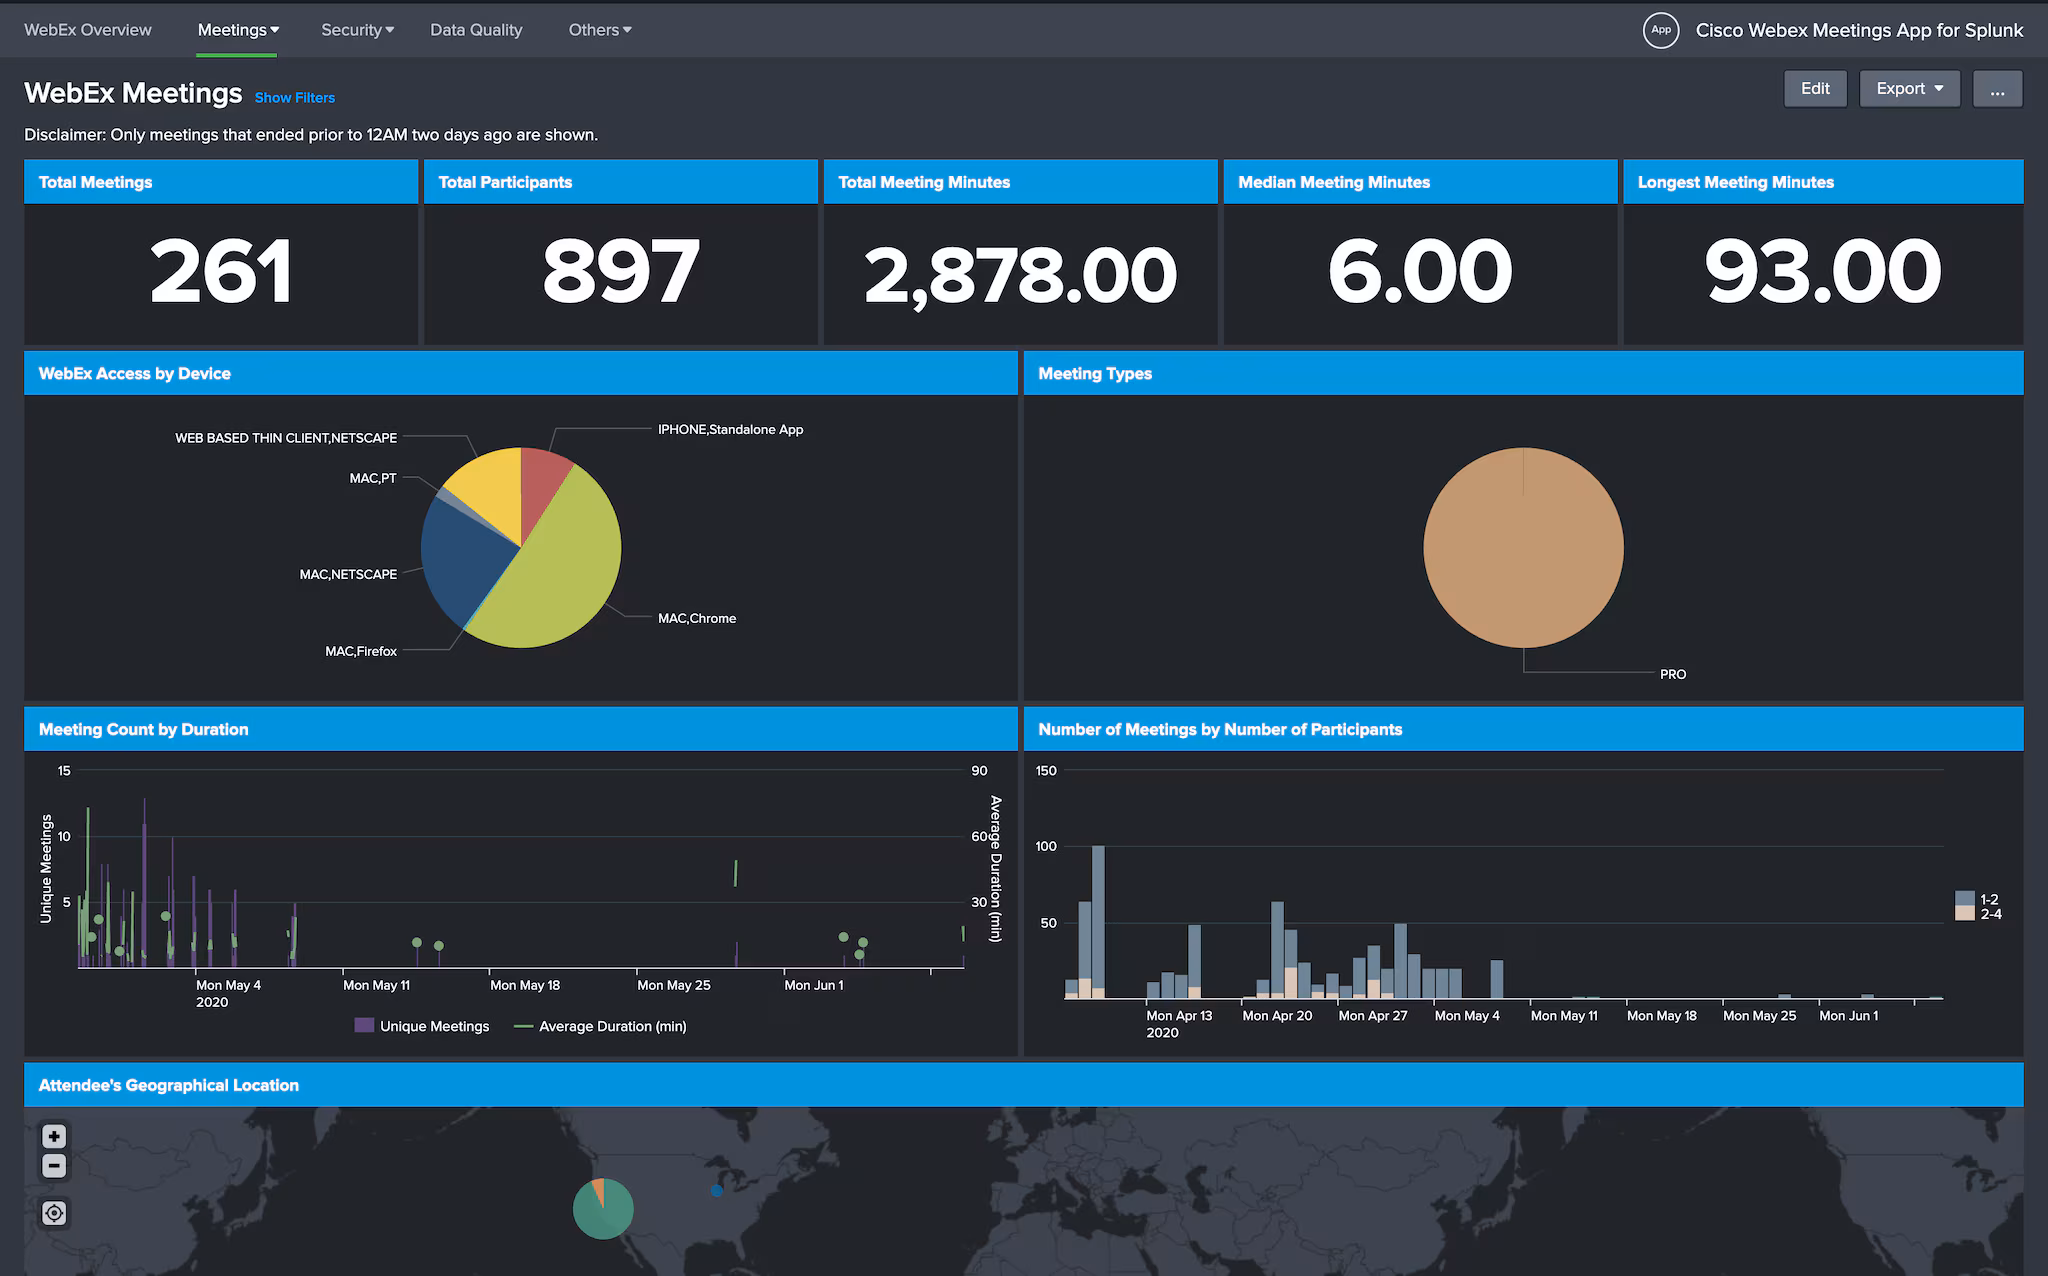
Splunking Cisco Webex Meetings Data