Observability Blogs
Latest Articles
template
category
category
observability

Understanding and Baselining Network Behaviour using Machine Learning - Part I
Learn about analytical techniques that help you to better understand your network and develop baseline for network behaviour and detect anomalies.
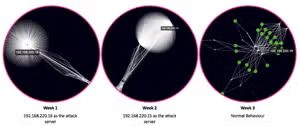
Understanding and Baselining Network Behaviour using Machine Learning - Part II
In this second installment we will continue to use the Coburg Intrusion Detection Data Sets (CIDDS) to determine baseline behaviour for one of the nodes we identified as critical in the first half of this series.
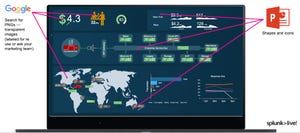
The Top 10 Glass Table Design Tips to Boost Your Career
Do not underestimate the power of great glass table design. Splunk EMEA Director of Product Marketing Stephane Estevez compiled 10 top tips on how you can step up your glass table game.
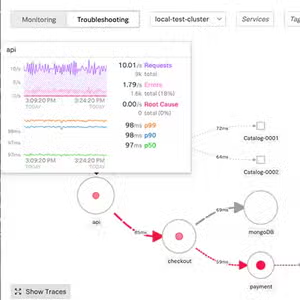
Application Performance Redefined: Meet the New SignalFx Microservices APM
Splunk's newest release of the SignalFx Microservices APM introduces innovations like Full Fidelity tracing, AI-Driven Directed Troubleshooting, and open framework instrumentation

Kubernetes Navigator: Real-time Monitoring and AI-Driven Analytics for Kubernetes Environments Now Generally Available
Announcing the general availability of Kubernetes Navigator, a turn-key solution that provides an easy and intuitive way to understand and manage the performance of Kubernetes environments

Monitoring Node.js Applications with Splunk Infrastructure Monitoring
Explore the various instrumentation approaches to building a robust observability strategy for your Node applications with Splunk Infrastructure Monitoring.
Monitoring Docker Containers on AWS ECS with Splunk Infrastructure Monitoring
Discover how you can use Splunk Infrastructure Monitoring to monitor Amazon ECS, and get the scoop on some of the newest updates.

Monitoring Windows Environments with the Splunk Infrastructure Monitoring Smart Agent
Splunk Infrastructure Monitoring's Windows Smart Agent provides people with the same automatic discovery and configuration capabilities delivered by its Linux-based counterpart, while also making it easier to monitor metrics that are unique to Windows environments.

The Daily Telegraf: Getting Started with Telegraf and Splunk
Infrastructure Monitoring with Telegraf metrics and The Splunk App for Infrastructure