Observability Blogs
Latest Articles
template
category
category
observability

Uncomplicate SLOs to Deliver Digitally Resilient Systems and Better Customer Experiences
With the launch of a built-in Service Level Objective (SLO) management experience in Splunk Observability Cloud, users get an intuitive experience for SLO creation with insight into the service's current performance.

Cisco and Splunk Bring Full-Stack Observability to the Entire Enterprise
Splunk and Cisco have teamed up to deliver engineers and ITOps teams with an improved leading observability experience.
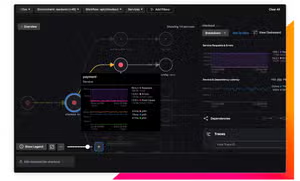
Harnessing the Power of Splunk APM Business Workflows in IT Service Intelligence
The latest release of the Splunk ITSI Content Pack for Splunk Observability Cloud now enables the automatic creation of ITSI services using service topologies from Splunk APM Business Workflows.

Tool Consolidation in the O11y World
Ending up with or having too many tools for monitoring is an age-old problem in the monitoring space. It has been around for decades. In fact I would go a step further and argue that it is much worse within the platforms of today then it was in days gone by. There is a direct correlation between the explosion of new, exciting and innovative technologies and services in modern platform development of today and the sheer volume of tooling you can easily end up with to monitor it. In this blog I explore what has driven the expansion of tools, how having too many is creating fundamental challenges in how these platforms are being managed, the negative impact that this has on innovation and, most importantly, what the solution is.
Cisco builds a unified observability experience between AppDynamics and Splunk
Seamlessly navigate AppDynamics and Splunk with unified observability. Enjoy SSO and context-aware deep linking for faster troubleshooting, improved productivity, and reduced MTTR.
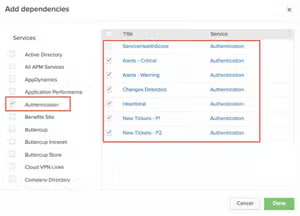
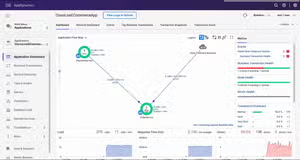
How To Visualize Business Service Performance with Splunk ITSI
Splunker Sid Govindu's guide is your starting point in leveraging Splunk ITSI for effective service decomposition and performance visualization.
Increase Your Data Flexibility with Explicit Bucket Histograms in Splunk Observability Cloud
As your tech landscape expands, so does the need for visibility across your ecosystem. Splunker Teneil Lawrence explains how to increase your data flexibility.

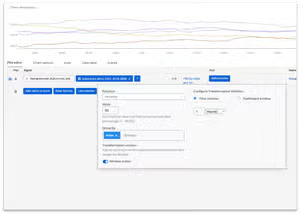
Maintaining Thresholds: Advanced Splunk Observability Detectors
Set up complex multi-signal alerts, consolidate multiple alerts into a single detector, and maintain sanity in a complex world with Splunk Observability Cloud.

The Cisco AppDynamics On-Premises Virtual Appliance: A modern observability platform with AI-driven insights
A cutting-edge solution that fortifies defenses against security threats, ensures robust performance of SAP® applications and business processes, and empowers teams with a proactive approach to maintaining system integrity and operational excellence.