
Digital Resilience Pays Off
Download this e-book to learn about the role of Digital Resilience across enterprises.
Splunk is committed to using inclusive and unbiased language. This blog post might contain terminology that we no longer use. For more information on our updated terminology and our stance on biased language, please visit our blog post. We appreciate your understanding as we work towards making our community more inclusive for everyone.
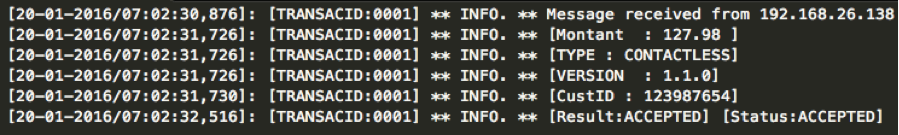
Do you remember this piece of raw data:
I hope so, it was on the blog only last week … 😉
Today, let’s focus on the value we can extract and how we’ll be able to address some of the IT challenges related to the company strategy.
IT Ops
What kind of information would be relevant for the application manager?
I am sure he would be interested by:
“What? You said geographic distribution? But I don’t have any details about the transaction location into the logs …”
True. But don’t forget you can enrich your raw data with the lookup feature! You’ve probably seen that there is an IP at the beginning of each transaction. We have a csv file (could be a database), referencing all our customer point of sales IPs with additional metadata like location, shop name, etc.
So here we are, a few queries later:
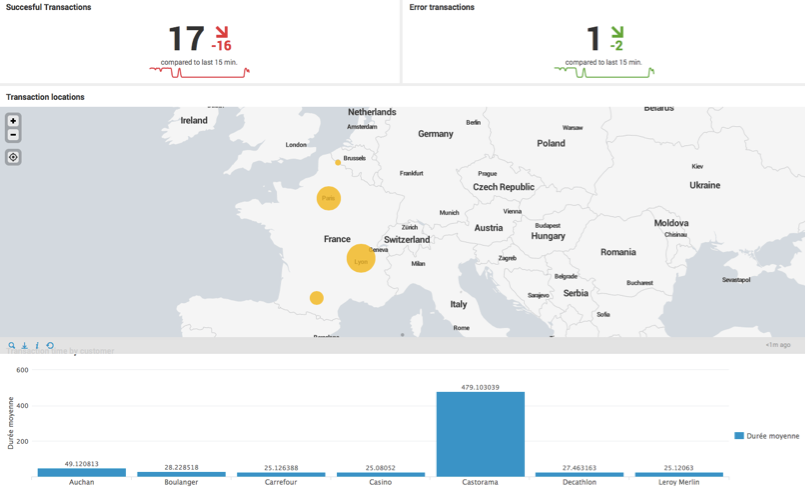
With this kind of dashboard, the application manager has a clear vision of its application performance with a set of critical KPIs : error number and transaction duration. As the company agrees on SLAs with its customers, the application manager needs to be able to meet them. Controlling the response time for customers helps him:
Business Analytics
What about a business manager, what information would he like to see?
Hmmm, probably:
“The value of the transaction was not used for the Application Performance use case, does it mean we need to reindex our data to extract this field?!”
Of course not … Do you remember “Schema on the fly”? This is exactly its purpose, selecting the field from the piece of raw data you want to extract at search time. You don’t need to know all the different use cases you will address based on this data before indexing it.
If not done, just configure the amount (“montant” in french) value extraction and build your dashboard (remember? just a few clicks)!
By the way, you heard right, I said “prediction“! Splunk Core has a standard command that leverages predictive algorithms. This is the predict command. Since last September, we also have this specific application called “ML Toolkit” that can be used to explore data, fit and apply advanced statistical models. This application is free and can be downloaded here.
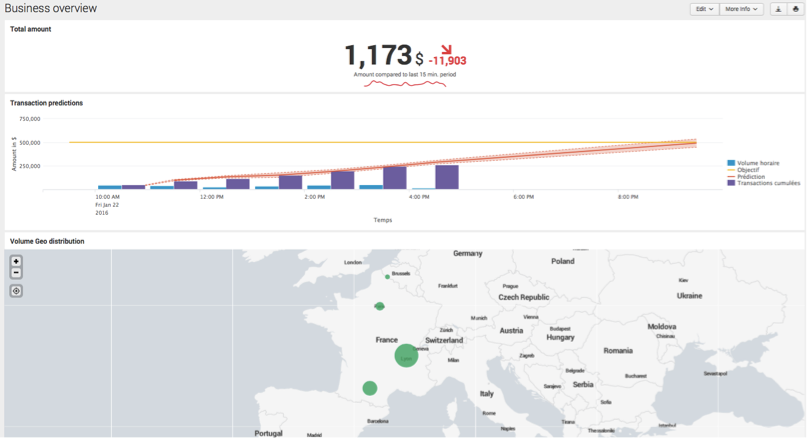
The Business Manager now has these KPIs in real time and can react quickly. Depending on your business, reacting in real time can be a game changer, like for Domino’s Pizza …
If your prediction tells you that you won’t reach your daily targets, there’s still time to see why and troubleshoot as soon as possible. Linking this business under-performance to a potential IT root cause can be done in a few clicks within Splunk.
Security
Finally, since these data are quite sensitive, a security analyst might want to monitor the transactions to see if there is an abnormal use of the service. What would be interesting for him?
Probably a single user doing different payments within the same day at point of sales located in different regions in France. It would potentially mean that their card has been corrupted / duplicated.
Ok, let’s build this dashboard! Just present all the cards (I translated it to custId into the piece of raw data) used in different locations within the same day and let the security officer drilldown/interact to investigate and confirm whether it’s an abnormal behavior or not.
“Interactions in your dashboard?”
Yes, that’s really powerful, you can introduce really simply interactions into your Splunk dashboards. Drilldown by clicking, selecting or even filling a free text area, here it is!
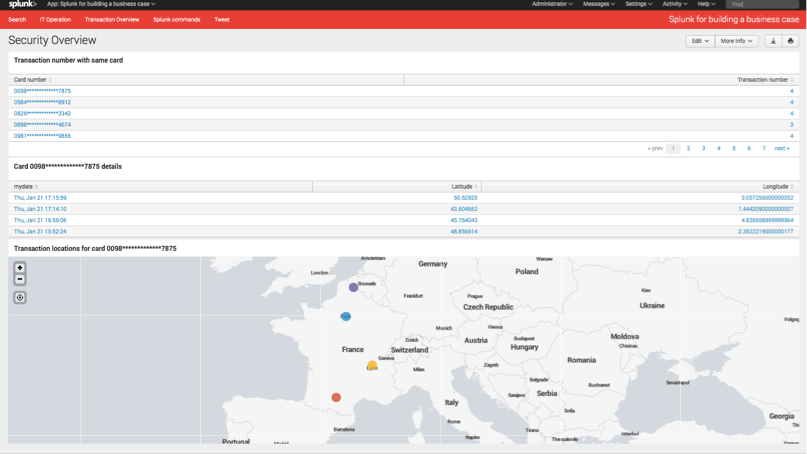
The security analyst can now list all the potential fraudulent transactions, deep dive and analyze them to confirm the potential fraud before calling the card holder. That’s great but it means the analyst would have to stay in front of his computer all the time … He probably has more value to deliver by doing other tasks! That’s Splunk next level of Operational Intelligence: Being proactive! Splunk keeps watch of specific patterns, trends and thresholds in your machine data so you don’t have to! Then Splunk sends you alerts on your favorite alerting channel (email, ServiceNow ticket, RSS feed, SNMP trap, etc.).
That’s it, one piece of raw data, three different use cases ! That’s Splunk.
If you have ideas, questions or feedback, tweet me @1rom1
----------------------------------------------------
Thanks!
Romain Testu

The Splunk platform removes the barriers between data and action, empowering observability, IT and security teams to ensure their organizations are secure, resilient and innovative.
Founded in 2003, Splunk is a global company — with over 7,500 employees, Splunkers have received over 1,020 patents to date and availability in 21 regions around the world — and offers an open, extensible data platform that supports shared data across any environment so that all teams in an organization can get end-to-end visibility, with context, for every interaction and business process. Build a strong data foundation with Splunk.

Get the latest articles from Splunk straight to your inbox.
© 2005 - 2024 Splunk Inc. All rights reserved.
