
Digital Resilience Pays Off
Download this e-book to learn about the role of Digital Resilience across enterprises.
Last year Splunker, Ed Hunsinger, wrote a great post titled, “Go Splunk Yourself“, in which he shows how he’s using Splunk to track data from devices including a Fitbit, a Nike Fuelband, a Basis Band, and a Garmin GPS watch to name just a few!
Like Ed, I use a number of tracking devices and I use Splunk to analyse the data they produce. Recently – as my friends and colleagues will tell you – I’ve taken this concept of self-tracking to the next level. This has included purchasing both a blood sugar and a blood pressure monitor.
After a few weeks collecting the data I’ve uncovered some interesting trends. If you’re interested what I’ve found or how you can do this at home, read on.
The great thing about buying tracking devices is that you can spend a lot of money, very quickly. For this experiment I wanted to keep costs down and opted for entry level kit. Here’s the equipment I bought:
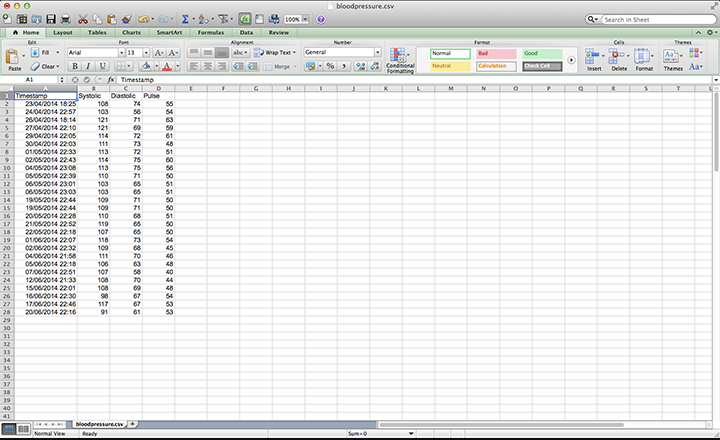
With simplicity in mind I used a very manual data entry process. I created two CSV files to input blood pressure and glucose respectively. In column A I included a timestamp with a minute granularity. I did this as it was simple to log, but highly precise for the level of my analysis.
You can download my CSV templates here:
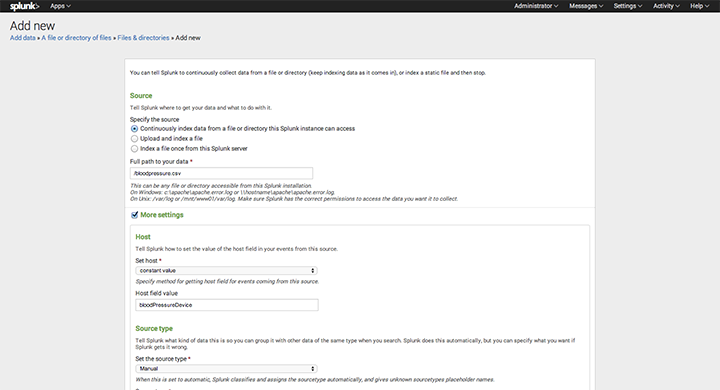
In Splunk I navigated to: “Settings” > “Data Inputs” > “Files & Directories” > “New”
Then I found and selected the CSV and clicked “Data Preview”. The timestamps looked good and I hit “Save”.
On the next screen, I set the source as: “Continuously index data from a file or directory this Splunk instance can access”. This means every time I save a new measurement Splunk automatically reads and indexes the change.
Altering the other fields on this page from the default, like “source”, may be useful but completely optional.
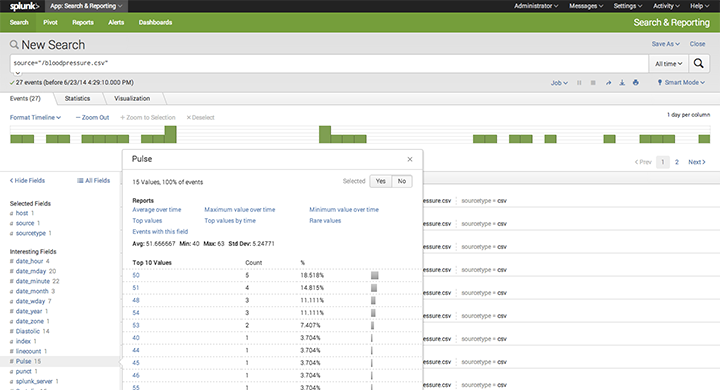
If everything has worked properly you should be able to see the fields extracted from the data correctly when running a search:
source="/bloodpressure"
Now for the fun to begin…
Looking at my pulse over time:
source="/bloodpressure.csv" | timechart avg(Pulse)
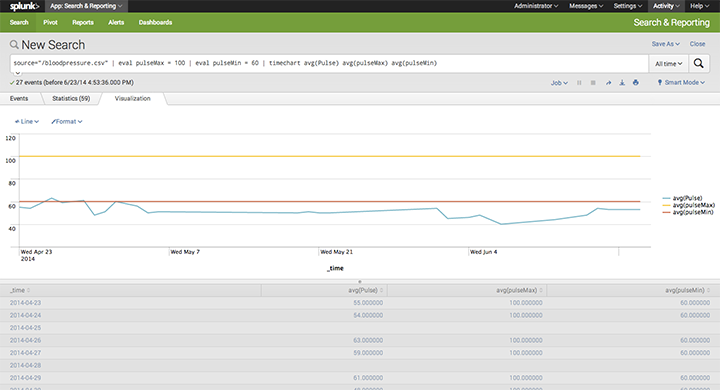
Great! But what does this mean? To add some context to the data I began by looking at what was considered a “normal” resting pulse. For this I used the reference ranges on the Mayo Clinic site – a max pulse = 100 and a min = 60. Of course, these should only be used as guides. To visualise this information I ran the search:
source="/bloodpressure.csv" | eval pulseMax = 100 | eval pulseMin = 60 | timechart avg(Pulse) avg(pulseMax) avg(pulseMin)
Looking at the chart above you can clearly see my pulse is regularly below the “normal” values. I attribute this to my fitness level but it will certainly be something to discuss with my doctor next time I visit for a checkup.
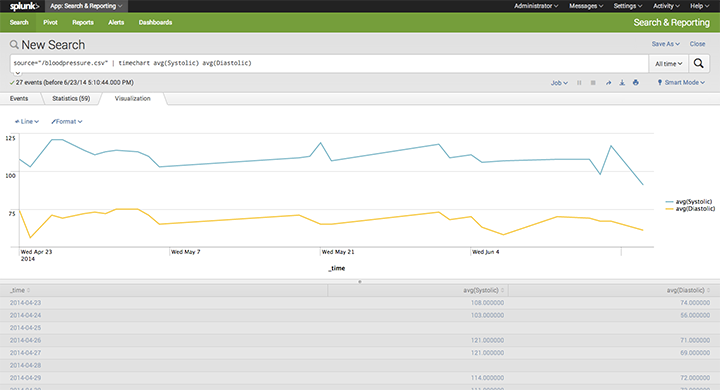
What about changes in blood pressure over time?
source="/bloodpressure.csv" | timechart avg(Systolic) avg(Diastolic)
Perhaps as expected, Systolic and Diastolic measurements correlate well. There are some spikes in Systolic readings, whereas my Diastolic measurements are fairly smooth. If you’re interested in learning more about these measurements for analysis, this site provides a great introduction.
I plan on adding further context to this data by including other life logging devices.
Like my Fitbit data, for example. Does more steps during the day have a noticeable impact on blood pressure readings taken each evening?
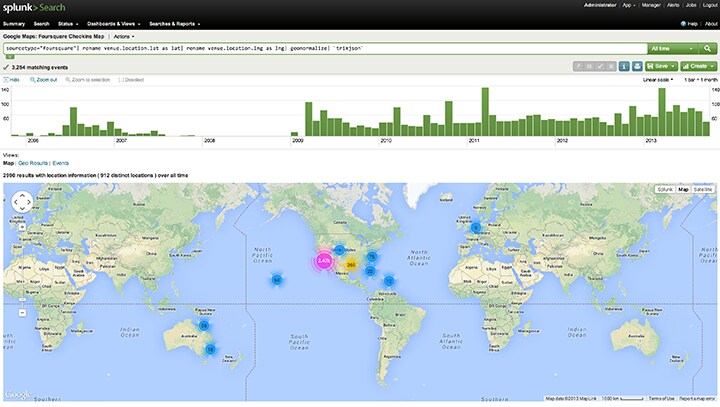
Other things like travel. Working for Splunk I’m fortunate to travel to different parts of the world but travelling through airports is stressful and staying in hotels can make it hard to eat well. If I compare my Foursquare checkins to blood data I can test wether distance travelled directly impacts upon my blood pressure and blood glucose readings.
I’ll keep you posted.
----------------------------------------------------
Thanks!
David Greenwood

The Splunk platform removes the barriers between data and action, empowering observability, IT and security teams to ensure their organizations are secure, resilient and innovative.
Founded in 2003, Splunk is a global company — with over 7,500 employees, Splunkers have received over 1,020 patents to date and availability in 21 regions around the world — and offers an open, extensible data platform that supports shared data across any environment so that all teams in an organization can get end-to-end visibility, with context, for every interaction and business process. Build a strong data foundation with Splunk.

Get the latest articles from Splunk straight to your inbox.
© 2005 - 2024 Splunk Inc. All rights reserved.
