How to Splunk Data from a Raspberry Pi – Three Easy Steps!
Last week we announced a release of our Universal Forwarder for Linux ARM (Raspberry Pi) which greatly simplifies the process of taking any data from a Raspberry Pi including GPIO or other connected sensors and attached shields and sending that data to Splunk. While this task was not impossible before, the process involved manual streaming of data to the Splunk API. Using a Universal Forwarder you can take advantage of Splunk’s end to end data distribution mechanisms with no need to understand or develop against Splunk’s API.
You can also take advantage of Splunk’s built in remote management and maintenance through its distributed deployment features. With these features you could update inputs and manage scripts on thousands of distributed Pi’s, collecting all of their data remotely and forwarding it to a central Splunk indexer. The potential there is only limited to your imagination and we will cover scenarios like this in future posts, but for now we will focus on building a super simple data connection which will send CPU data from a single network connected Pi to a single instance of Splunk running on a network connected laptop or desktop.
Step 1: Install and configure Splunk on your laptop or desktop.
First, download Splunk 6 from our download site. Install using the documentation and default settings. Once Splunk is installed, you should open a browser and go to http://localhost:8000. You will be presented with a login page. For the first login use the username “admin” and password “changeme”.
Once you login, you will see a popup describing new features in Splunk 6. Close this out and you will be ready to configure!
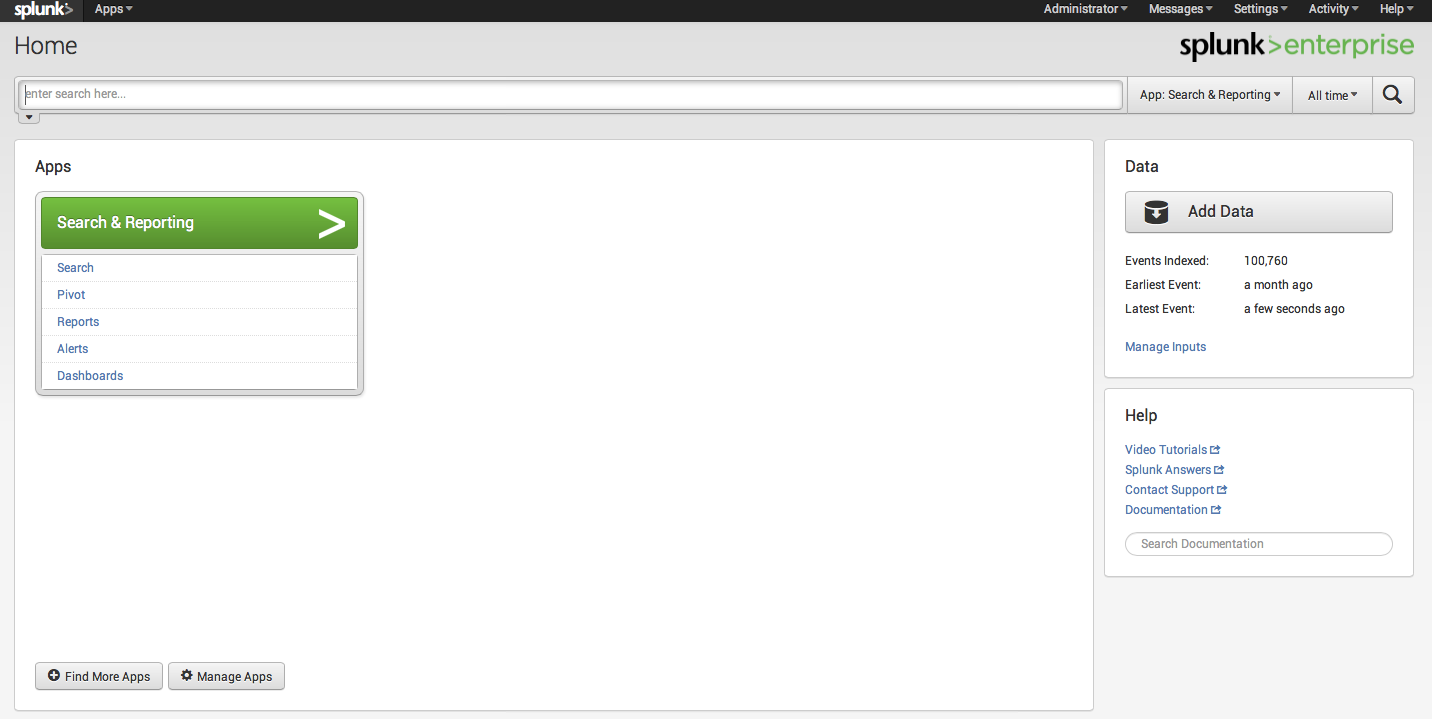
In the upper right, click the dropdown for “Settings”. Under Data, click Forwarding and receiving, and you will be taken to the configuration page where you can set Splunk to listen for data from your Pi.
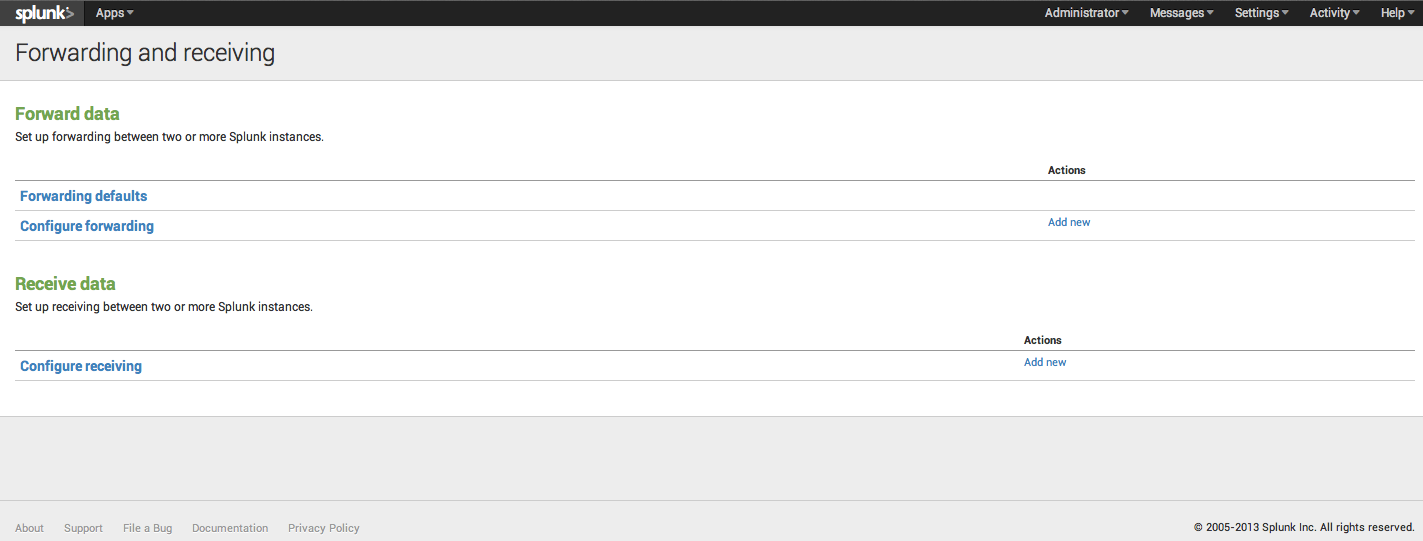
Click “configure receiving”, and you will be taken to the receive data configuration page. Assuming this is a brand new installation of Splunk, you will have no configurations. Click “New” and you will be taken to the new configuration wizard. For now, we will just add a new listener at port 9997, and click Save.
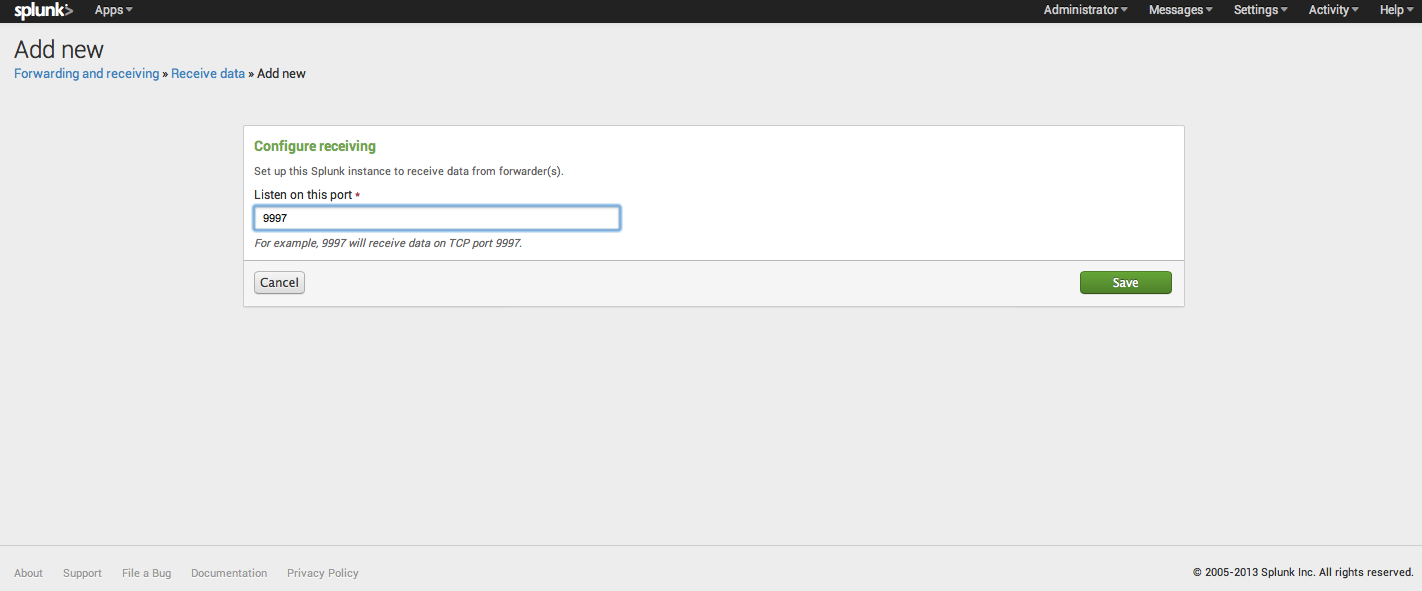
Splunk is now listening for data from a Splunk Universal Forwarder on port 9997. You will need to make sure that the machine your Splunk instance is running on has the appropriate firewall ports open. Congratulations, your Splunk instance is ready to receive data from your Pi!
Step 2: Install the Splunk Universal Forwarder on your Raspberry Pi.
Download the Universal Forwarder from https://splunkbase.splunk.com/app/1611/ to your Pi. Despite the “installation instructions” mentioned during the download process, this distribution is actually a Splunk installable, and NOT a Splunk app. For my Pi, running Raspian, I used (word for word) http://docs.Splunk.com/Documentation/Storm/Storm/User/Setupauniversalforwarderonnix and it worked out great. One important thing to know when installing the Universal Forwarder on *nix, is that the default install does NOT autorun on boot. You can set it to autostart running the following as root: $SPLUNK_HOME/bin/Splunk enable boot-start, but please see the documentation at http://docs.Splunk.com/Documentation/Splunk/6.0/Admin/ConfigureSplunktostartatboottime for more detailed instructions.
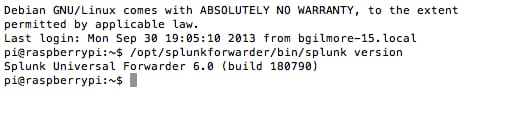
There are all kinds of tweaks etc. you can run on the forwarder, but for simplicity’s sake we will leave everything as default. To start Splunk on your forwarder, navigate to $SPLUNK_HOME /bin/ and run ./splunk start. You’ll see the standard output for startup. At the next prompt, run ./splunk version, and you should see the version output for ARM Linux. Congratulations, the Splunk Universal Forwarder is running on your Raspberry Pi!
Step 3: Configure scripts and Splunk Universal Forwarder .conf files to send data to Splunk.
IMPORTANT: These directions are a quick start, not best practices. For complete information, including best practices, please refer to the complete documentation at http://docs.Splunk.com/Documentation/Splunk/6.0/Data/Setupcustominputs#Add_a_scripted_input_via_inputs.conf.
Configuring the Pi to send data to your laptop is as easy as adding a script to a directory, and editing two configuration files. That’s really it. For this example I’ll demonstrate how I wrote a simple bash script to query the system for CPU temperature and voltage. One thing I made sure of when writing the script, is that I was formatting the data in a way that Splunk would easily be able to automatically extract timestamp and field information. While this is not completely necessary, because I’m writing this script to send data specifically to Splunk, it’s really a no brainer as it will save me additional configuration file edits and field extractions on the indexer. For more information on this type of logging, please see our logging best practices http://dev.splunk.com/view/logging-best-practices/SP-CAAADP6.
So here is my simple script (cpu.sh), I created it in $SPLUNK_HOME/bin/scripts:
#! /bin/sh
for c in $(seq 1 60)
do
TIME=$(date +"%D %T.%3N %Z")
TEMP=$(vcgencmd measure_temp)
VOLTS=$(vcgencmd measure_volts)
CPU_TEMP=`echo $TEMP | cut -d \' -f 1`
VOLTS=`echo $VOLTS | cut -d V -f 1`
echo "time=$TIME|$VOLTS|$CPU_TEMP"
sleep 1
done
Complex, huh? Not really. Here’s the thing though, this script can be anything, as simple or as complex as you need it. As long as it will run from a command line (the universal forwarder uses environmental variables to run the scripts), any information printed to the standard output will get sent to the Splunk indexer (after we configure the conf files to schedule the script and send the data). So echo is all we need in this case to push ANY data from Pi to our indexer!
We now need to schedule our script and configure the forwarder to forward our data. In $SPLUNK_HOME/etc/system/local/inputs.conf, I’ve edited the file to read (based on my Splunk install):
[default]
host = raspberrypi
[script:///opt/Splunkforwarder/bin/scripts/cpu.sh]
index = main
interval = 60
source = cpu_details
sourcetype = pi_system_scripts
For detailed information, please see http://docs.Splunk.com/Documentation/Splunk/6.0/Data/Setupcustominputs#Add_a_scripted_input_via_inputs.conf, but basically we have directed the universal forwarder to create an input of type script, directed the input to the specific script, and then set a few parameters, including directions for the indexer (what index to store the data in), the frequency to rerun the script (60 seconds), and predefined the sourcetype and source.
Finally, we need to configure outputs.conf to send the data to our specific indexer. I’ve edited the outputs.conf file in $SPLUNK_HOME/etc/apps/SplunkUniversalForwarder/default, but again, definitely take a look at the documentation for best practices.
#   Version 6.0
[tcpout]
defaultGroup=my_indexers
[tcpout:my_indexers]
server=XX.XXX.XX.XXX:9997
Where XX… is the IP of my indexer. So with a quick restart of the universal forwarder on the pi with the command ./splunk restart, we are getting data on our indexer. That’s all it takes! In summary:
- Install a Splunk instance to receive your data. (A)
- Install the Splunk Universal Forwarder on your Raspberry Pi (B)
- Configure scripts to poll your Pi data on a regular basis of your choosing, and configure the inputs and outputs conf files on the Pi to send data B->A
Hope this helps you get your Pi to Splunk project up and running. Please experiment. Keep in mind that you can use this same process to send any data from many Pi’s to a single indexer, scalability and flexibility are what Splunk’s Universal Forwarder is all about. If you have any questions or comments, please send me a tweet at @BrianMGilmore, and keep an eye out for future blogs on working with Splunk and data from the Raspberry Pi!
----------------------------------------------------
Thanks!
Brian Gilmore
Related Articles

Top Three Risks Faced By Asian Financial Services

Fighting Fraud, Waste, and Abuse in Government

Helping Law Enforcement with Call Detail Records

Splunk Becomes a TISAX Participant

The Public Sector's Worst Nightmare: Fraud

Insights from Public Sector Leaders: Understanding the State of Security and Lessons learned

Splunk Partners with Internet2 to Make Solutions More Accessible for the Academic Research and Education Community

Visible Risks Assessments in the Financial Services Industry