Protecting Critical Apps in the Age of AI Agents
Security Kashyap MerchantKey takeaways
- AI is speeding up cyberattacks, giving security and operations teams less time to figure out which service is affected and how serious the risk is.
- Splunk links runtime attack detection with security investigation tools, so evidence like a Log4j exploit automatically flows from detection to prioritization to analysis.
- Combining application and security context helps teams protect customer-facing services from downtime while responding to threats faster and with less manual work.
A security alert says an application may be under attack. An observability dashboard shows the service is healthy.
Which signal should the team trust?
Both signals are valid, but neither is enough on its own.
Security teams need to know whether suspicious activity reached running code, which service is affected, and whether that service matters to customers. Operations teams need to understand the potential blast radius: whether the threat could affect availability and whether remediation could create a second incident.
This context gap has existed for years. What has changed is the time available to close it.
The Attack Clock Has Changed
AI-assisted development helps teams build and modify applications faster. More code, services, APIs, and third-party dependencies are reaching production.
AI is changing the threat side as well. Agentic attacks can compress timelines from days or hours to minutes, generating signals across a broader attack surface faster than human teams can interpret them. Following recent frontier AI incidents, the UK NCSC has called for real-time oversight and clear response plans. Security and Operations have less time to determine whether suspicious activity reached running code, which service is affected, and whether technical risk could become business disruption.
The issue is not simply detecting attacks faster. A threat can be detected in seconds and still take teams hours to connect it to the affected service, owner, and business impact.
Meanwhile, a single customer journey or business transaction may cross containers, microservices, APIs, virtual machines, and traditional systems. Finding the threat is only the beginning. Teams need to understand what it can affect before it becomes a business incident.
Two Teams, One Critical Service
Security and Operations teams approach the same incident from different perspectives.
A Security analyst wants to know what happened, whether the activity represents a credible threat, which other indicators are connected to it, and what needs immediate investigation.
An Operations engineer wants to know whether the affected service is live, whether it is receiving traffic, what depends on it, and whether customers or SLOs are at risk.
Splunk connects these perspectives.
Splunk Observability Cloud provides the operational and application view: service, environment, runtime behavior, dependencies, traffic, health, and available business context.
Splunk Enterprise Security provides the security view: detections, findings, entities, risk, correlation, and analyst investigation workflows.
Together, that context helps teams answer the questions that guide a coordinated response:
- Did the suspicious activity reach running application code?
- Is the affected service live and in production?
- Does the affected service support a critical or customer-facing workflow?
- Who owns the affected service?
- What action can address the threat without unnecessarily disrupting the service?
That is digital resilience in practice: keeping a critical service reliable while responding to risk.
What This Looks Like in Splunk
Consider how an exploited Log4j attack moves through this workflow. The following views show the progression of the same threat from runtime detection to Security prioritization and investigation.
Secure Application uses existing application instrumentation in Splunk Observability Cloud to monitor supported runtime behavior for cloud applications. In Figure 1, the attack detail view grounds the exploited Log4j event in its observed host, service, environment, event trigger, timestamp, and outcome. Available evidence can also include the associated vulnerability and execution context.
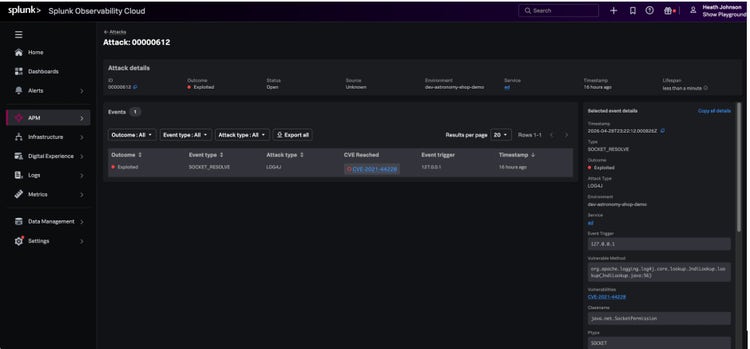
The value is not simply that an attack was detected. Splunk Observability Cloud ties the event to the application that is actually running and provides service and environment context for assessing operational relevance. Operations can use that context to evaluate potential service impact, while Security teams receive evidence grounded in the runtime.
When configured, Secure Application can send the Log4j attack event and its context to Splunk Enterprise Security through Splunk HTTP Event Collector (HEC).
In Splunk Enterprise Security, the Splunk Secure Application Alerts for Runtime Security detection processes the secureapp_attack events.
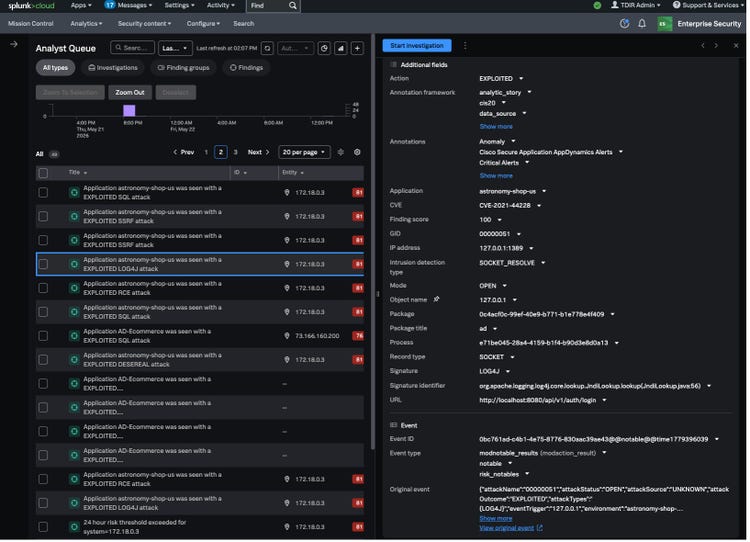
The detection recognizes supported application-layer activity that can include SQL injection, API abuse, unsafe deserialization, remote code execution, and Log4j exploitation. It maps Secure Application fields into Splunk Enterprise Security and applies severity and risk logic. In Figure 2, the same Log4j attack is prioritized in the Analyst Queue with application, CVE, outcome, IP address, signature, URL, and finding score.
From the Analyst Queue, a Security analyst can open the Log4j finding as an investigation and manage it in the workflow already used by the team. Figure 3 illustrates how the analyst reviews the same attack with its description, application, entity, source, destination, owner, and status in one place. Analysts can then correlate that evidence with identity, endpoint, network, and threat-intelligence data already available in Splunk Enterprise Security.
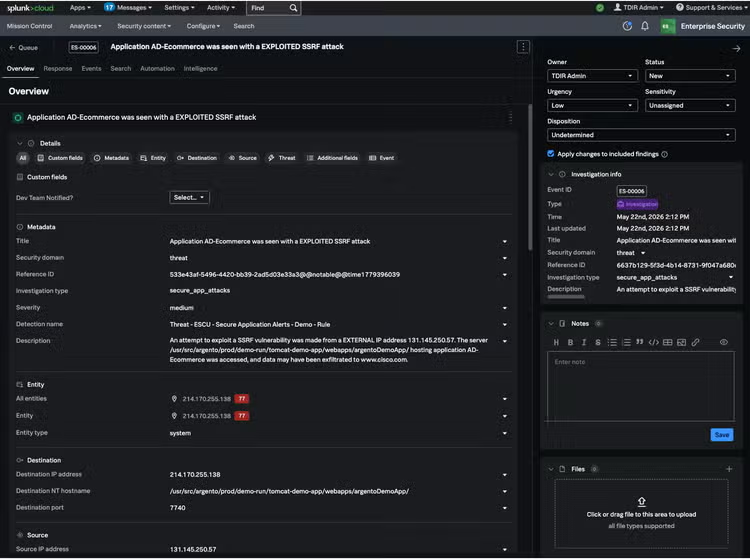
Together, the three views follow one Log4j attack through detection, prioritization, and investigation. Security teams gain runtime evidence for deciding whether the attack requires immediate attention. Operations teams gain the service and environment context needed to assess potential effects on availability, SLOs, and customer experience.
After remediation, each team can use its own workflow to confirm that the suspicious behavior is no longer observed and that the service remains healthy.
The real value is simple: the evidence travels with the incident. The next team does not have to start from zero.
One Approach Across the Application Estate
In our earlier article, Splunk Delivers Unified Security and Observability to Protect Applications, we showed this workflow for hybrid and on-premises applications monitored through Splunk AppDynamics.
The same approach can be used for cloud-native and microservices-based applications through Splunk Observability Cloud and the Splunk Distribution of OpenTelemetry.
That continuity matters because most enterprises run mixed estates. A critical service may cross cloud-native and traditional systems, but the teams protecting it should not need a different investigation model for every architecture.
The questions remain the same: Is the threat active? What service does it affect? How important is that service? Who needs to act?
Why Better Together Matters
For Security, application and runtime evidence supports faster triage and better prioritization.
For Operations, relevant security context makes it easier to understand risks to availability, SLOs, and customer experience.
For both teams, carrying evidence into the next step reduces manual correlation, repeated investigation, and cross-team handoff delays.
This application-threat workflow is one practical example of what better together means for Splunk: Observability context makes security findings more actionable, while Security context helps Operations protect service resilience.
Configure the Integration in Four Steps
The Splunk real-time cloud application threat detection guide walks through the complete configuration.
Before You Begin
This integration requires:
- Splunk Enterprise Security 8.0 or later
- Splunk Observability Cloud with agent version 26.4 or later
1. Create the Secure Application Source Types
Create the secureapp_attack and secureapp_vulnerability source types in Splunk Enterprise Security. These source types allow attack and vulnerability events from Secure Application to be parsed correctly.
2. Configure Enterprise Security to Receive Events
Configure HTTP Event Collector in Splunk Enterprise Security and generate separate HEC tokens for attack and vulnerability data. Associate each token with its corresponding Secure Application source type.
3. Send Secure Application Events to Enterprise Security
In Splunk Observability Cloud with agent version 26.4 or later, configure attack and vulnerability notifications in Secure Application. Point each notification to the appropriate raw HEC endpoint and authenticate it with the corresponding HEC token.
4. Enable the Enterprise Security Detection
In Splunk Enterprise Security 8.0 or later, install or update Splunk ES Content Update. Locate and review the Splunk Secure Application Alerts for Runtime Security detection, then enable it.
The integration can send both vulnerability and attack events. The referenced Splunk Enterprise Security detection specifically processes the secureapp_attack event stream.
Technical Resources
- Runtime application security with Splunk
- Introduction to Splunk Secure Application
- Splunk Secure Application Alerts for Runtime Security detection
- Splunk real-time cloud application threat detection guide
See It at .conf26
Join us at .conf26 in Denver, September 14–17, 2026 to see the workflow live.
Come to session Rapidly Detect AI Agent Risks With Splunk And Cisco [OBS1910]
We will show how Splunk Observability Cloud detects an active application threat, how runtime evidence is brought into Splunk Enterprise Security, and how Security and Operations use the combined context to protect a critical service.
An alert tells you that something happened. Resilience comes from knowing what it affects and acting together.
Related Articles

Logs Are For Campfires: Log Data, Big Data, and Splunk Asset & Risk Intelligence

Cloud Federated Credential Abuse & Cobalt Strike: Threat Research February 2021