Token Meter: A Live Cost Meter for Your Coding Agents
Artificial Intelligence Pratik Bhavsar , Paul LaceyKey takeaways
- Token Meter tracks coding agent costs like Claude, Codex, and Cursor in real time, right from your computer's menu bar, with no data leaving your machine.
- Using Token Meter helped cut weekly AI coding costs by about a third through ending stalled sessions, switching to cheaper models, and disabling unused tools.
- The tool includes budget alerts, an efficiency dashboard, and MCP integration, letting users spot wasteful spending and compare models without leaving their coding agent.
You kick off a refactor in Claude Code and go make a coffee. Ten minutes later, it is still working and you have no idea whether this run costs one dollar or hundred.
That gap is why we built Token Meter. It reads the trace files your agents already write to disk, prices them against public model rates, and shows you the cost before you get the next bill or a call from your manager. It sits in your menu bar. No API key, no account, nothing leaves your machine.
Three months of running it against my own work cut my weekly agent spend by roughly a third without sacrificing code quality. Most of the savings came from three habits the tool made obvious: ending sessions that had turned into dead weight, routing routine work to cheaper models, and turning off tools. (That’s right, less is more!)
You get a browser-based dashboard plus a native companion for your OS — a menu-bar app on macOS, an app tray on Linux, and a notification-area extension on Windows (beta). You set your own per-session and monthly budgets and it tracks them with alerts as you go. If your team rations tokens, you can see exactly how much headroom is left and plan around it.
Coding agents: Claude, Codex, Cursor, OpenCode, Kiro, and Pi
Platforms: macOS, Linux, Windows (beta)
Get Started
On macOS or Linux:
git clone https://github.com/splunk/token-meter.git
./token-meter/scripts/install
The installer starts the local server and the native companion along with autostart. Open http://127.0.0.1:8722, run your agent like normal, and pick the session from the list. The server uses the Python standard library alone, binds only to 127.0.0.1, and never asks for admin.
Windows is in beta and has its own bootstrap command in the repo README.
How To Use Token Meter
Back to that refactor example. Token Meter picked up the session the moment the trace started.
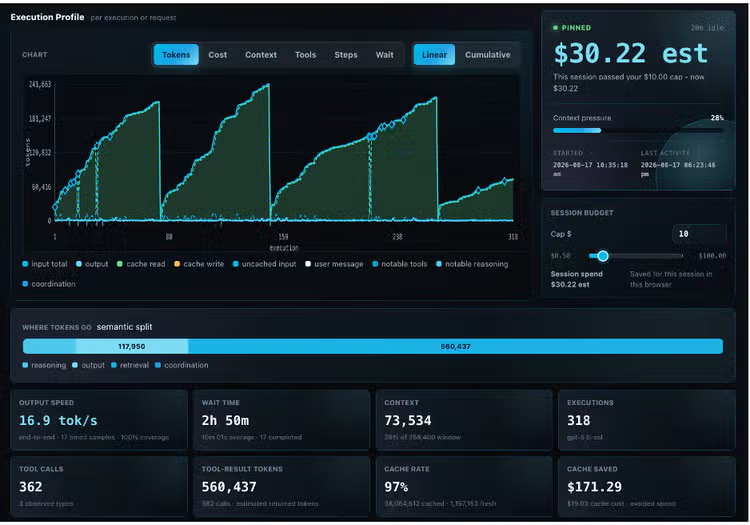
Ten minutes in, the menu bar reads about six dollars. Context is sitting around 60 percent and output is streaming out around fifty tokens a second. Cost is climbing, but so is the work, so I let it run.
Five minutes later it reads twelve dollars. Context is near the ceiling and the output speed has dropped to a crawl. I check the dashboard. The session is now spending most of its money re-reading its own history on every turn. That is the cue to start a fresh session or trigger compaction. I trigger compaction after which my responses finish much faster at a lower cost.
I avoided restarting because I would lose agent's working context and spend a few minutes re-priming it. A clean start is only worth it once a run has clearly stalled in speed or quality. Some days I let an expensive session finish because my time is worth more than the tokens it is burning. The point is that I am making that call in the middle of the run, with the curve in front of me instead of finding out later.
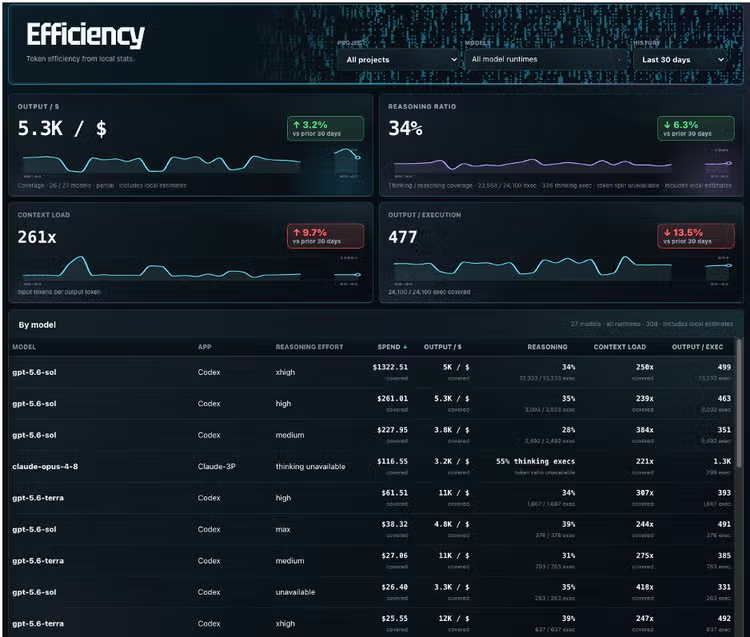
The Efficiency view makes those tradeoffs easier to compare over time. Instead of hiding everything behind one score, it shows output per dollar, reasoning ratio, context load, and output per execution for each model and reasoning effort. The numbers tell you the most when you read them together:
- Rising context load with falling Output / $ can indicate a growing context tax.
- High reasoning ratio with low output per execution may point to an overthinking or overly fragmented usage.
- Falling spend with stable Output / $, lower context load, and acceptable results is a credible efficiency improvement.
To act on this, pick one of your highest-spend models and establish a baseline over comparable work. Then change one variable at a time — model, reasoning effort, skills, prompt structure, context size, or task decomposition — and watch several similar runs before you decide whether the change actually helped.
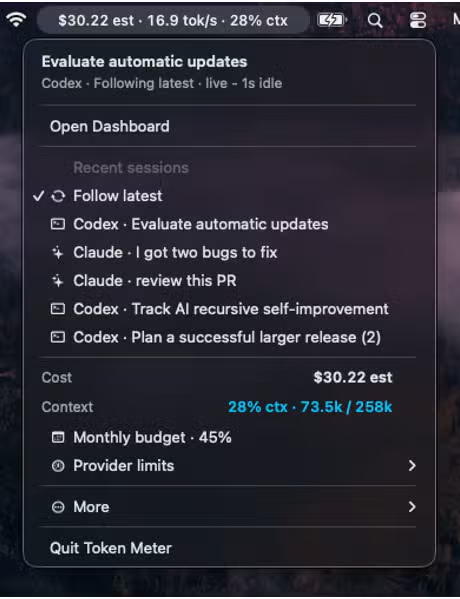
The menu bar turned out to be the part I reach for most. I assumed everyone would live in the dashboard, but the dashboard is where you investigate a run, and the menu bar is how you decide whether a run is even worth investigating. That matters most when three agents are going at once and you need to know which one to watch.
The live run view holds more than the two numbers in that story. It shows:
- Output speed in tokens per second
- The time the run spends waiting on the model
- The split between fresh input and generated output
- Every tool call with how much it handed back
Output speed is its own tell: when it sags while cost keeps climbing, the model is usually chewing on a heavy context rather than doing new work. Alongside the run, the dashboard keeps a timeline of raw events, a tools tab for stats on usage, an insights tab for derived signals, and an alerts tab for budget state. It’s a one-stop view for analyzing your session and understanding where the tokens went.
Reduce Spend Using Token Meter
Budget Management
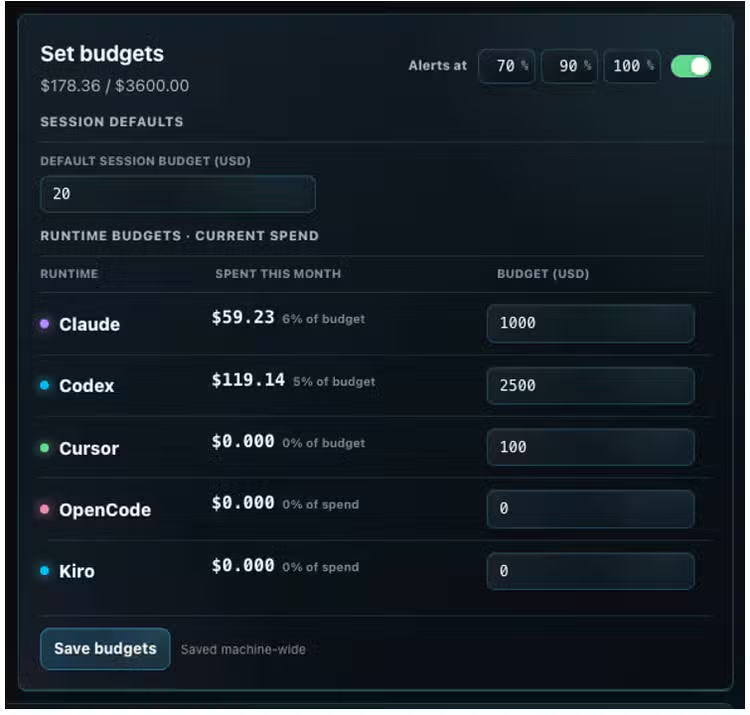
Usually I set a per-session budget and a monthly one. Token Meter fires a notification when a run crosses the line or the cost spikes, and otherwise stays quiet in the menu bar. That is the setup that fits a real working day: heads down, with a tripwire instead of a babysitter. The live curve is there when an alert or a slow session sends me looking for it.
Model Routing
A lot of what an agent does all day is simple enough for a cheaper, faster model, so the easy savings come from not paying premium rates. Run the same task on two models first, read the gap in cost and output speed side by side, and route it down to the smaller one once the numbers back you up.
Skill Management
A single skill pack you never trigger can quietly add thousands of tokens to every request, and the Tools view makes that dead weight easy to spot by ranking each capability on how often you actually use it and how much it hands back. Switch off the ones not pulling their weight. If you thought giving your agent more tools was a good idea, this will put that in perspective really fast.
MCP Insights
And when you would rather ask than dig, the read-only MCP server lets you pull this data straight to Claude or Codex, so you can pull usage insights without ever leaving the agent you are already working in. Go to settings, connect with claude and codex, and then restart your coding agent to get these MCP tools:
- usage: Review spend, model mix, tool-result volume, and daily changes across today, 7-day, and 14-day windows.
- sessions: Find current, completed, or historical sessions using runtime, model, state, and time filters.
- trace: Inspect executions, events, tool activity, context growth, retries, failures, coverage, and warnings for a session.
- stats: Compare tokens, estimated cost, timing, context, executions, and tool activity across agents, models, days, sessions, and tools.
What Else Can You Do With It
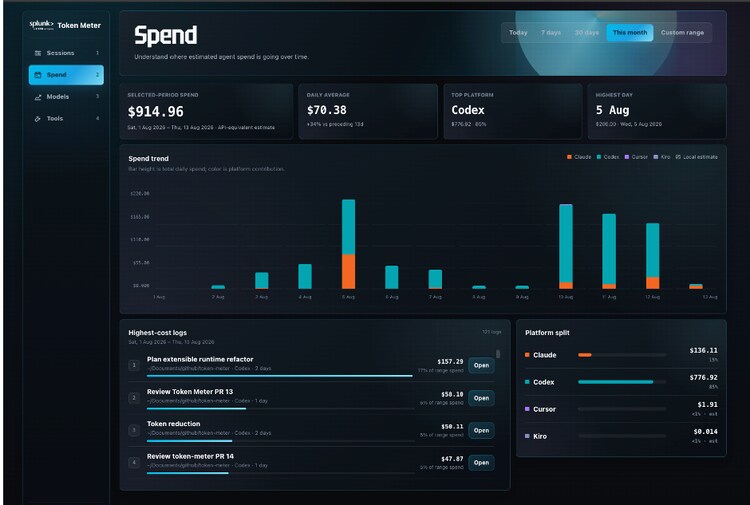
After a few weeks, here are the questions I stopped guessing at:
- What have I spent on this project over the past week?
- How fast does each model actually generate tokens?
- How big is the context window in the run I am in right now?
- Where did my time and tokens go across all of last week?
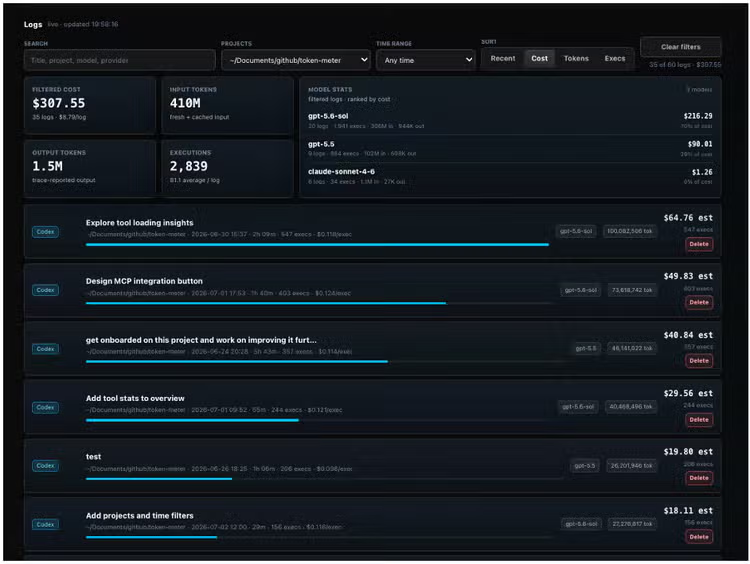
- Which logs were the expensive ones? Search and filter by title, project, model, provider, or time, then sort by cost or tokens.
- How often did my sessions hit signs of frustration, like retry loops and repeated errors, over the past few days?
If You Are on a Subscription
If you pay for Claude Max or a Cursor plan, your marginal token cost is close to zero and dollars are not really your problem. Quota is. Token Meter reads provider-reported limits, so the useful reading becomes how much headroom is left before you hit a cap in the middle of a task, and how one session compares to another. The dollar figures still work as a relative yardstick even when they are not your invoice.
What It Does Not Do
Token Meter computes costs from public price tables, so the numbers are API-equivalent estimates, not a reconstructed invoice. For deciding what to do next, the relative reading is what you need: this session versus that one, this model versus that model, the slope right now versus five minutes ago. The to-the-cent figure is not the point.
It also will not tell you whether the work was any good. A cheap answer that fails its tests is expensive. A slow session that quietly fixes production is a bargain. Quality comes from your evals and your own review. Token Meter measures the cost and leaves the verdict to you.
Built To Extend
Token Meter started as a Mac utility that understood Claude and Codex on MacOS, but has quickly grown due to contributions from other developers. Read our contributing guide and help extend it for your needs.
Try it today!
git clone https://github.com/splunk/token-meter.git
./token-meter/scripts/install
FAQs about Token Meter
Related Articles
Introducing the Ransomware Content Browser

Threat Advisory: Telegram Crypto Botnet STRT-TA01