Platform
The Splunk Platform
The extensible data platform powers unified security, full-stack observability and limitless custom applications.
Overview
Unify your data on a flexible platform for the hybrid world
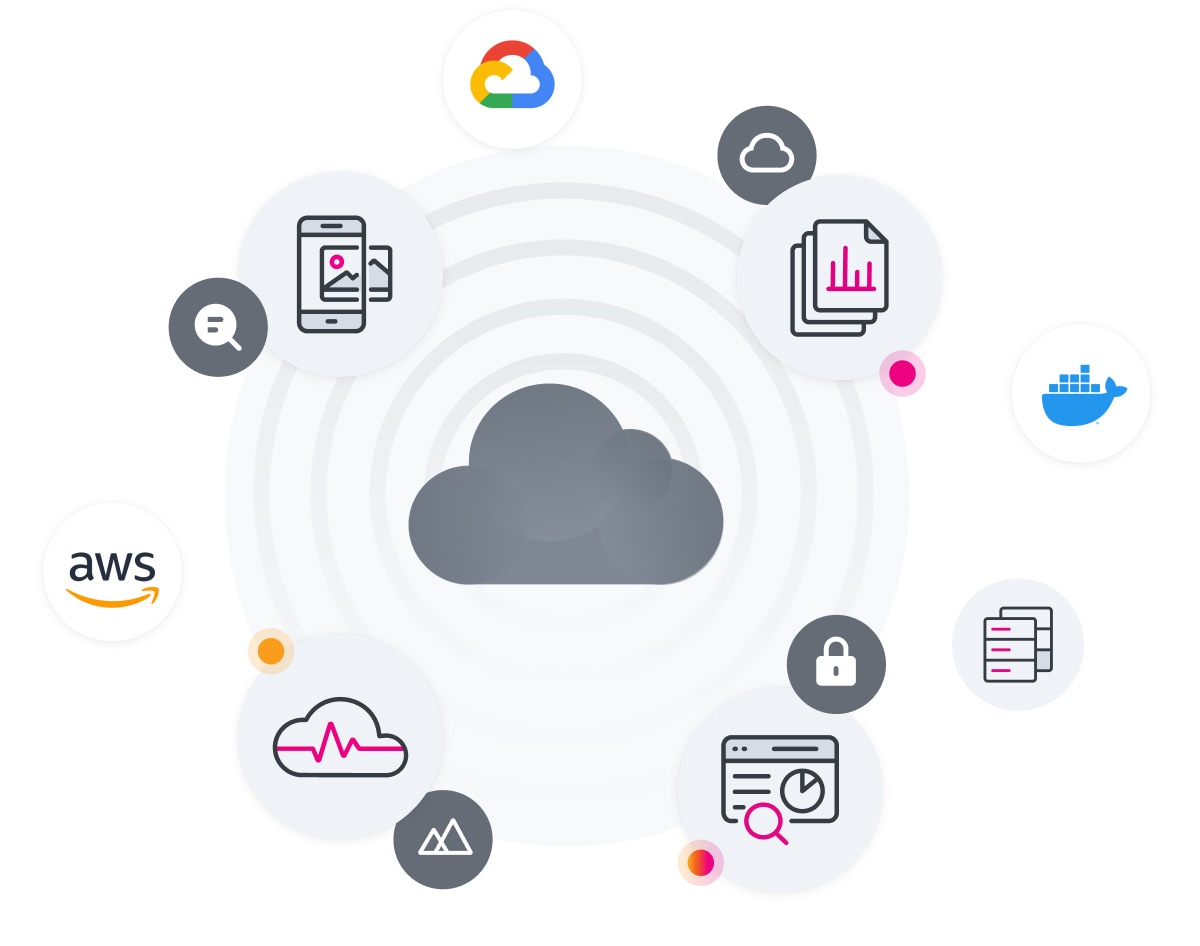
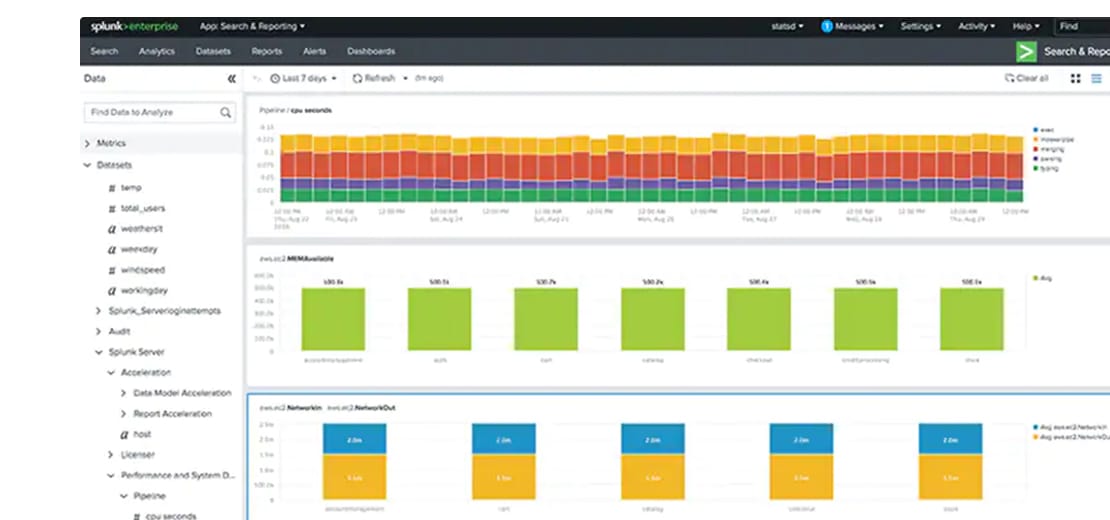
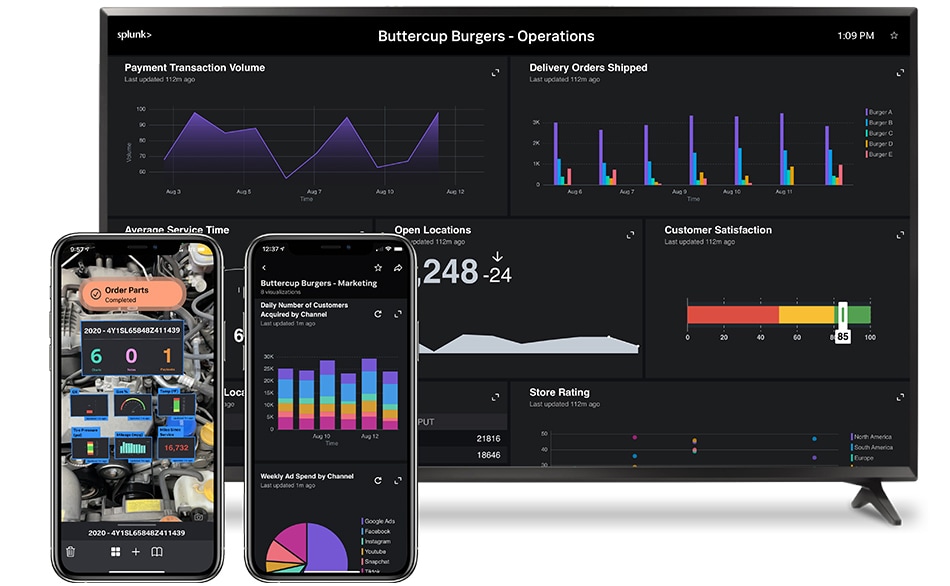
Data accessibility
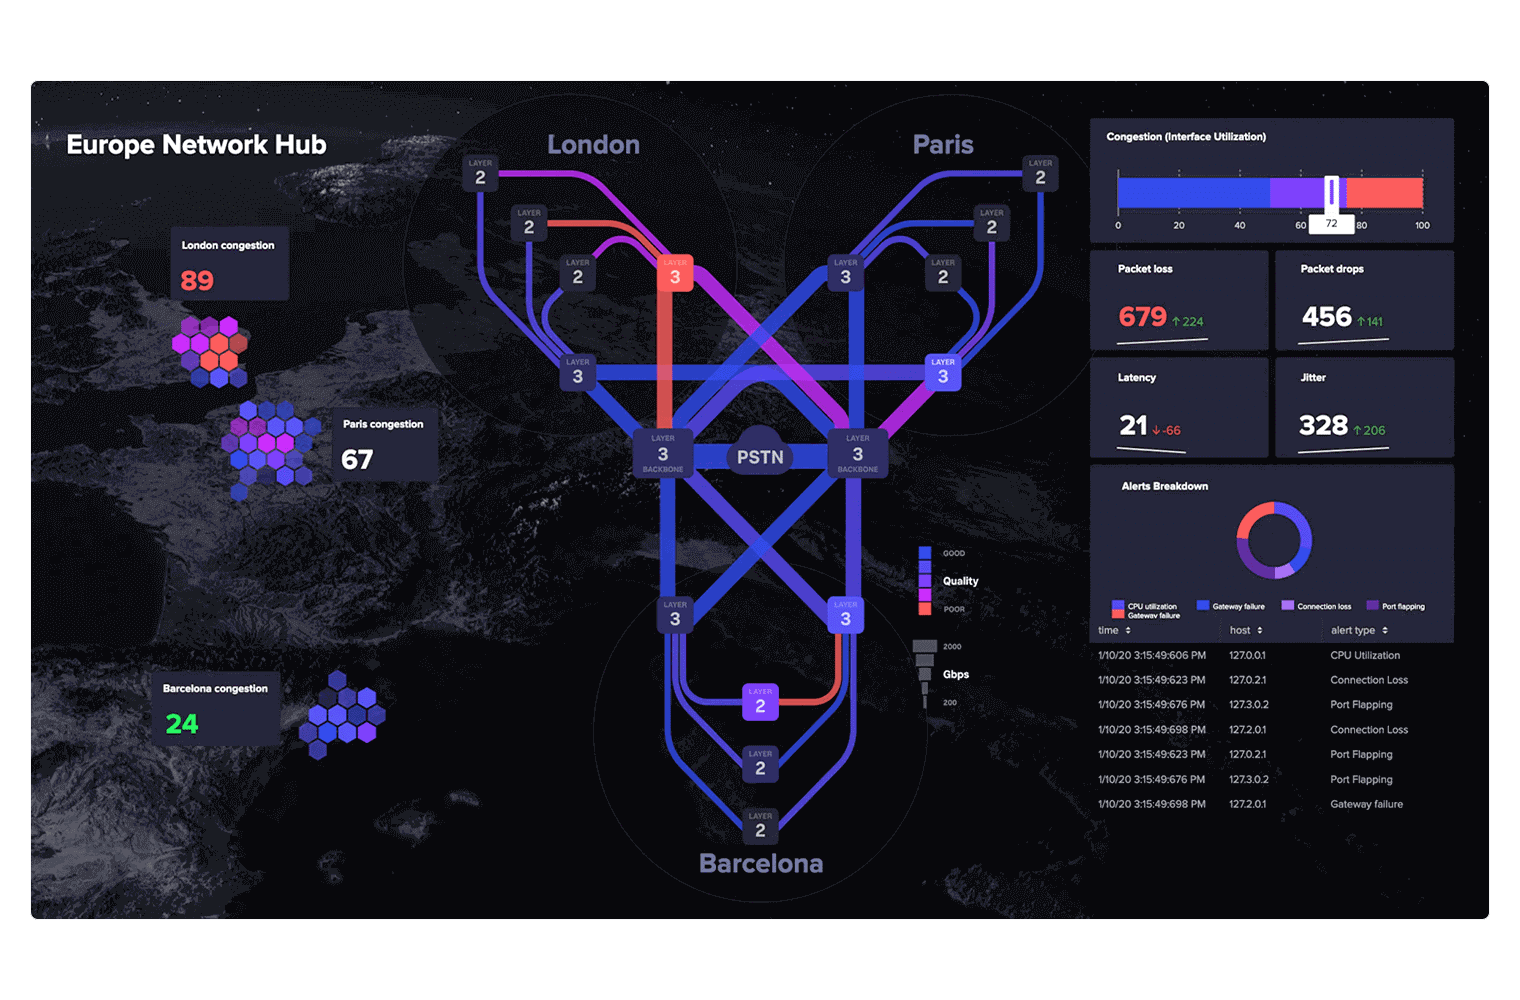
Access and search data from any source and across any device.
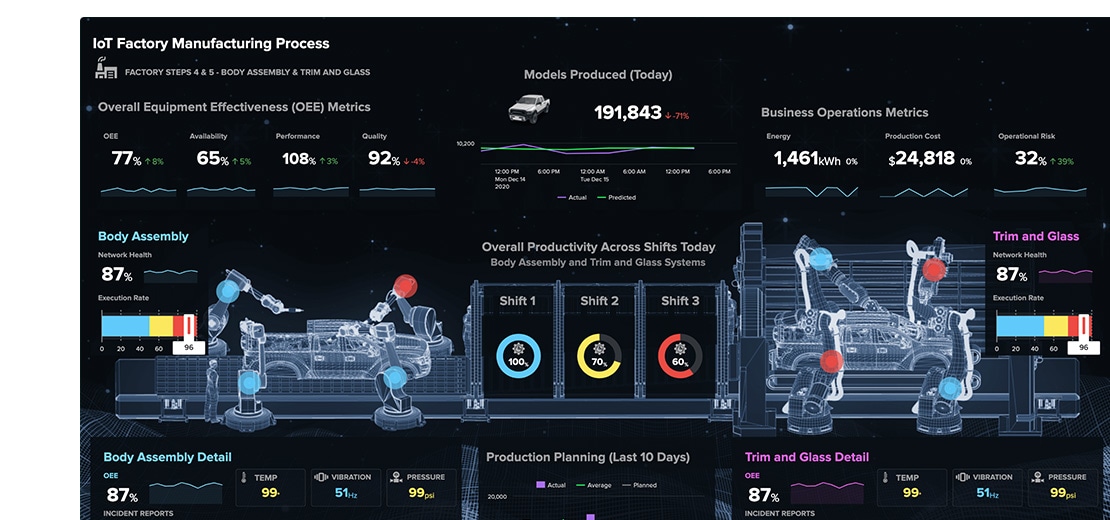
Business insights
Share data-driven insights across your enterprise.
Usability and collaboration
Remove data silos in your organization to work smarter across all of your user groups.
USE CASES
Solve it with Splunk
Cloud migration
Stay agile and flexible so you can drive high performance and excel in the cloud.
Isolating problems in cloud native environments
Cloud native apps are complex. With Splunk Observability, one engineer can confidently solve problems across their entire system.
IT modernization
Maintain high IT service uptime while improving efficiency and reducing alert storms.
Related categories
Security
Modernize your security operations and protect your business with data, analytics, automation and end-to-end integrations.
Observability
Go from problem detection to resolution with end-to-end visibility across your infrastructure, applications and digital customer experience.